Category: Calculator

The Farm Carbon Calculator just got better!

As a leading carbon assessment tool, The Farm Carbon Calculator is updated on a regular basis. We do this so you benefit from the most recent science, can access additional features, and have an improved experience completing reports. Read on to find out more.

Key Takeaways

  • Reports ending on or after 01 April 2025 will use the updated emissions factors outlined in What’s Changed 2025
  • Some changes have been backdated to improve all reports from 01 January 2000 onwards – these will only be applied if you recalculate a report or edit an item.
  • To maintain a record of your original report, LOCK and do not edit old reports
  • Instead, make a copy of an old report – this will apply any backdated changes and give you the option to compare to the original report to see what has changed
  • If you are making a new report you will have many more options for adding:
    • Specific sprays (branded herbicides, fungicides etc.) “Inputs > Sprays” section
    • Branded & generic fertilisers “Inputs > Specific fertilisers” section
    • Imported organic fertility sources and the emissions from their application “Crops > Organic fertility sources”
    • Potential sequestration from Agroforestry areas “Sequestration > Agroforestry” section
Photo credit: Rob Purdew – Farm Carbon Toolkit

Our Development Cycle

Every April we release updates to the methodology behind the Calculator as well as tweaks to the ways reports are made. 

This Spring we will update the calculator 3 times; 

  • Our annual comprehensive methodology and functionality update.
  • Improvements to how we calculate livestock emissions.
  • Improvements to our calculations of land-use change emissions.

We’ll focus here on the first of these which will launch on 1 April 2025. Our methodology is the combination and range of formulas which sit behind the calculator and help us calculate emissions on any farm in the UK. We have updated the emissions factors in this methodology, we added new ones, and we have acted on your feedback to improve the way the calculator looks and feels to ensure the system continues to work for you.

Emissions Factors – if you were wondering – are the variables used in the formulas behind your report. They tell us, for example, the emissions produced when fuel is burned, and the emissions produced in manufacturing the fuel in the first place.

Our updated methodology is used for the main calculator at https://calculator.farmcarbontoolkit.org.uk, and also by many users of external applications. For example, many farm management systems, banks, and consultants rely on our methodology, as well as multiple white labelled or more specialised calculators across the agricultural industry, and beyond – like the Equine Carbon Calculator.

We’re talking here about thousands of farms creating multiple thousands of reports every year – our team spends the bulk of their time ensuring everything fundamental is right!

We know changes to methodology affect carbon reports, and carbon reports reflect your farm – so you deserve to know a bit about how this is changing. Let’s ask the obvious question first:

Why does the methodology keep changing?

In short, because the underlying sources have changed or updated. The calculator sits on top of thousands of hours of research and experience, coming from within our team over 16 years of development, from agronomists and farmers, from academia, and the research arms of governments and international organisations. The result of this work is the wide range of sources you can see on our references page. 

Emissions factors change 

Every spring, all emissions factors are checked, and in some cases are changed – for our April 2025 methodology that is 3,000 existing factors, and 7,000 new ones! We update some factors to match new versions of existing data sources, such as annual governmental data sets like the UK GHG inventory which details UK industrial emissions. Our factors and data sources also change as new items are added, better sources become available, and in some cases, factors change because sources fall out of use as they become outdated or irrelevant. Overall the methodology relies on 114 references which can be found on our references page, or listed with each item in our data collection sheet, which can be downloaded from our resources page.

Changes to emissions factors also occur because more industries are undertaking more rigorous carbon footprinting so we can get a better estimate of the emissions from producing, transporting and using various products. This work provides us more granular detail on emissions and allows us to give you more options when selecting items in your reports. 

Moreover, as sectors decarbonise, the emissions associated with utilities and commodities change, and thus we need to update emissions factors to reflect this. As an example, this year the emissions associated with the average tariff for electricity have reduced by nearly 10%, due to an increase in the proportion of electricity coming from renewable energy. We therefore want you to see the benefit in your reports as industries decarbonise, so your electricity use this year will be lower than the year before even if the same quantity of energy is used. This should not deter you from making your own efforts to decarbonise, but does allow you to share the benefits of UK progression. 

Emissions calculations undergo review

Sometimes the calculations underlying your report change because of an improved understanding of biological systems or a re-interpretation of the available evidence. In a developing field like agricultural carbon footprinting, working with other organisations to make sense of the available evidence and international guidance within the UK context can help us identify areas where calculations can be improved. This is why we continue to seek pre-competitive collaborations with other companies and research organisations (to find out more about the projects and harmonisation work).

One such calculation that has undergone re-interpretation is the calculation underpinning organic fertility emissions. With a better understanding of the underlying processes, and the components relevant to the equation, we have been able to add more specificity and more options to the organic fertility options. You will now see options for when and where fertility sources are applied, and for manures you will have the ability to select application approaches – meaning emissions mitigation approaches such as deep-injection of slurry are appropriately adjusted. Changes like these allow you to better understand your carbon footprinting journey and allow a more nuanced appraisal of your farming emissions. We are striving to increase the specificity of the calculator, aiming to provide you the user with the opportunity to enter the highest tier of emissions calculation. 

There are 3 tiers of GHG emissions calculations

Tier 1: This tier uses default emissions factors and data from the IPCC for different climatic regions to generate broad estimates. The use of global data and a general approach results in low accuracy.

Tier 2: This method enhances accuracy by using emission factors specific to a country or region and more detailed activity data, such as local energy consumption. This approach is more accurate than Tier 1 because it incorporates factors that are more relevant to the specific conditions of the region.

Tier 3: Uses real-time data, sophisticated models, and system-specific emission factors, and is the most accurate method, using detailed modelling or direct measurements, as well as highly specific data for the particular circumstances of the country or sector.

We are striving for tier 3 where practical in your reports, however, the reality is that most people do not have time to enter the copious data required for accurate calculation at tier 3.

Changes to the calculator

As explored above, an update like this one has introduced many changes, you will see these highlighted in full: 

One example of an item on the calculator that has recently changed is sugar beet crop residues. In 2024, we updated and improved our methodology that accounts for the N2O emissions associated with crop residues decomposing in the field after harvest. This used crop N contents and harvest index ratios from the UK GHG Inventory (1990- 2021 Inv) plugged into the IPCC 2019 refinement crop residue calculation, making it a Tier 2 method. This calculation gave sugar beet a relatively high emissions factor compared to other crops.

This year the UK GHG inventory released a new version (1990 – 2022), which has updated their values for sugar beet. This update by the UK GHG inventory includes adjusting the harvest index, lowering N contents for aboveground and belowground residue and lowering above to below-ground residue ratios; all of which are used for “deriving a country-specific parameter for sugar beet residue emissions”. This has resulted in a 77 – 89% decrease in the April 2025 update depending on the residue management practice. As this is such a large change, which has been updated with better data, we have decided to backdate this emissions factor to ensure drastic changes between years for the same amount of crop residue are not reported. 

Not all changes in the calculator are this drastic, and in the “What’s Changed” document you will see a list of changing emissions factors.

So will my carbon footprint go up or down?

We can’t predict with certainty how annual updates will affect your report because every farm is different, but we know there will be changes. It very much depends on what you do on the farm and the best way to see this will be to copy a report, change the end date and see for yourself. We will see some examples of farm reports below. Changes to how you farm will, in most cases, have a larger and more important monitorable effect than changes to the methodology we talk about here.

In other words – if it is your focus, keep looking for ways to reduce emissions on your farm! Bear in mind that changes to practice can take time to show up in your carbon footprint and may have other impacts, be it environmental (benefitting biodiversity, reducing water use, cleaning soil and air pollution), social (ensuring food security, providing jobs, leaving space to roam, nurturing communities) or financial (boosting profits, building resilience, or ensuring financial security). These impacts may not result in reduced carbon emissions, however at FCT we fully support farmers taking a holistic all-encompassing approach to improving their sustainability. If you would like support or advice on reducing your farm’s footprint as part of the wider context of your farm, our advisors can help.

The rest of this blog will dig into some examples of what might change for some example reports.

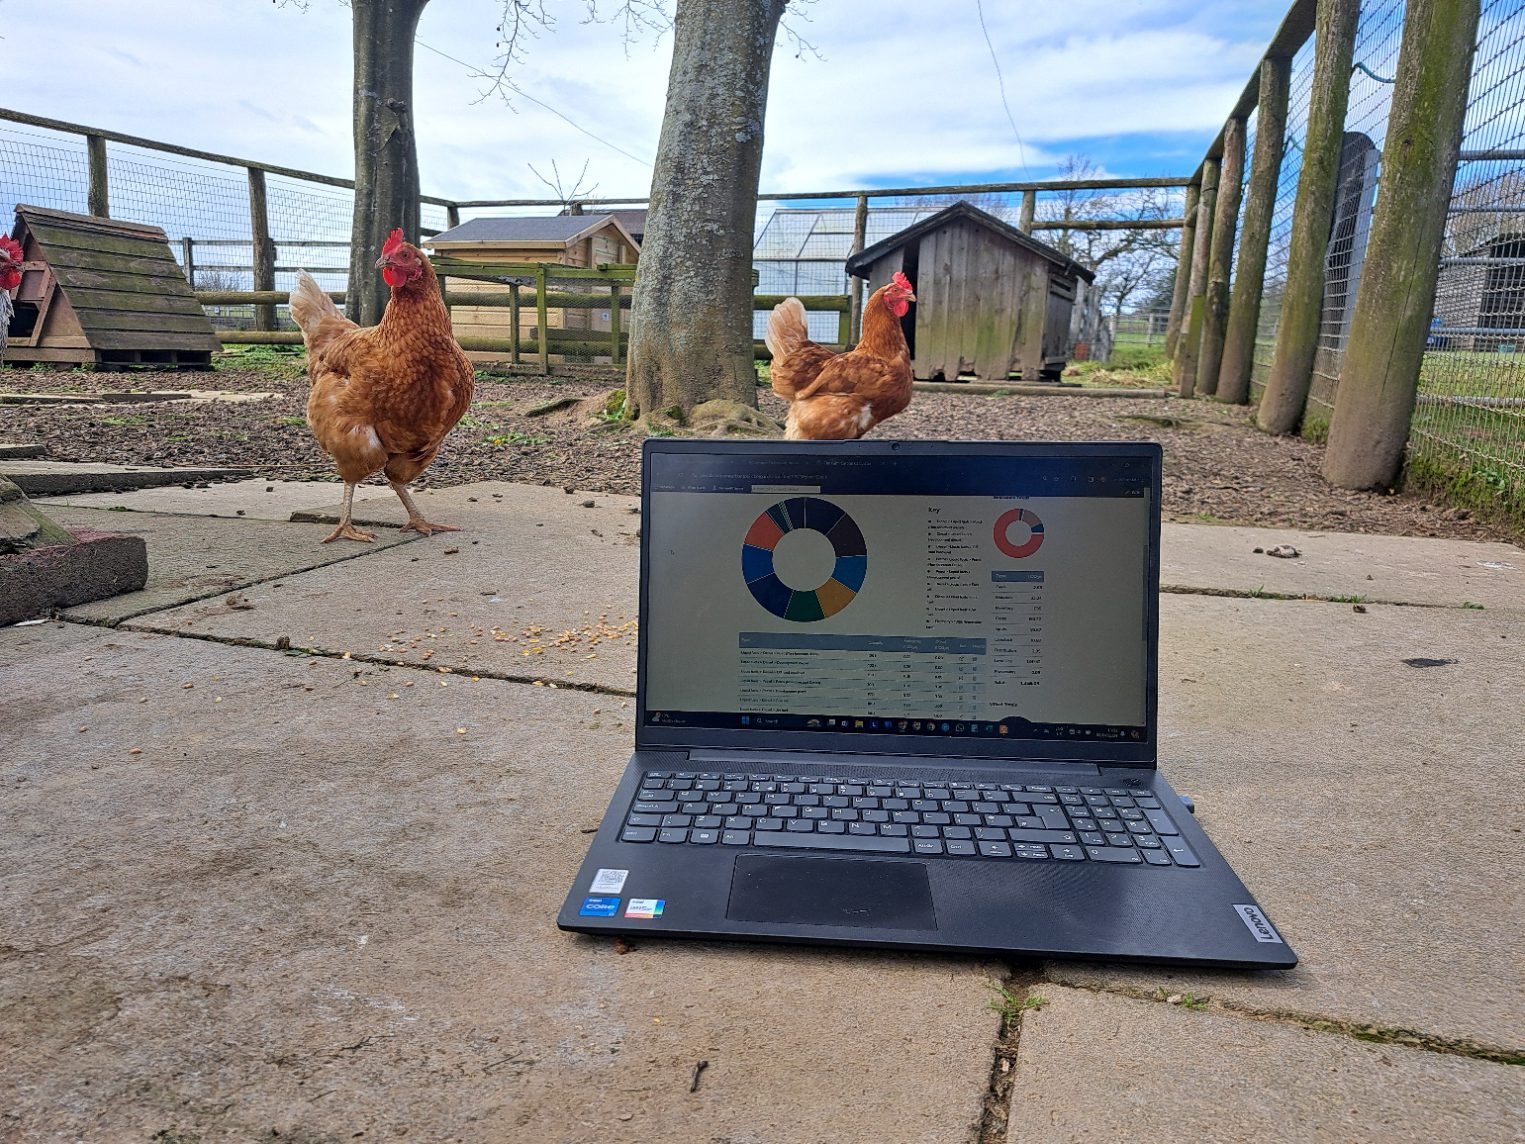
Visualising the changes with example reports

We have created example farm reports that compare emissions factors before and after the April update for various farming systems. These reports, which span April 2023 to March 2024 and April 2024 to March 2025, use consistent items and quantities to ensure the thing changing is the emissions factors. It’s crucial to remember that actual farm reports will vary year-to-year due to changes in both practices and purchased materials, not just emissions factors.

As you can see in Figure 1, comparing the same reports across both periods does not result in large differences. Table 1 gives the percentage change in the total carbon emissions (tCO2e) and total carbon balance (which includes carbon removals by sequestration – tCO2e) for each report. On average, reports with the updated emissions factors resulted in a decrease in total carbon emissions and total carbon balance. This will vary depending on what items have been chosen in reports. 

Figure 1. Carbon emissions and sequestration in tonnes of carbon dioxide equivalent (tCO2e) for farm reports for the years 2024 and 2025. These reports represent individual farm examples and do not represent an average of that farming sector.

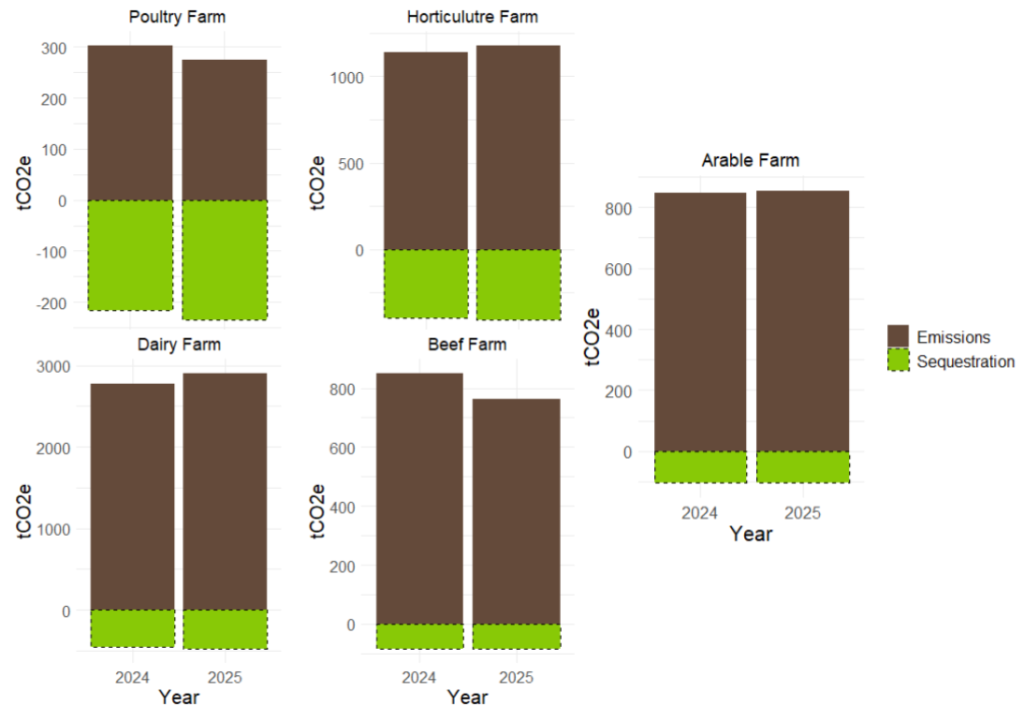
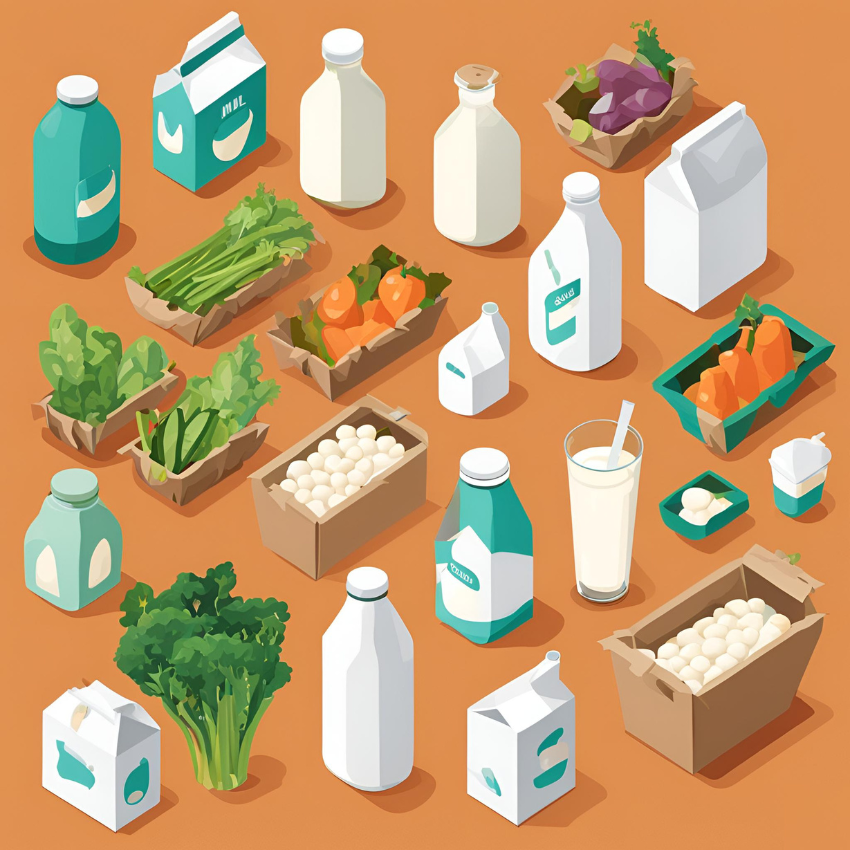
The dairy report experienced an increase due to livestock feeds being updated with the latest Global Feed LCA Institute source (GFLI). In comparison, the poultry and the beef report experienced a decrease in emissions due to updating this same source, as some feed items have increased, whilst others have decreased.

The large decrease in the carbon balance for the poultry report is due to a combination of emissions factors decreasing e.g. livestock feeds and bedding (-21.58%), materials (-8.86%) and fuels (-5.43%) alongside changes in carbon sequestration factors (-8.75% i.e. an increase in sequestration), resulting in a relatively large decrease in the carbon balance. 

The arable and horticulture report have remained relatively similar with changes below 5%. To see a more detailed breakdown of what changed in these reports and in the calculator, check out our What’s Changed document

Report% Change in Emissions% Change in Balance
Arable0.871.11
Beef-10.48-11.65
Dairy3.785.43
Horticulture3.543.91
Poultry-9.16-54.30
Average-2.29-11.10
Table 1. The percentage change in carbon emissions and carbon balance for each report.

It’s not just changes – there are new items too!

Importantly, we also use this update to add in new items that people have requested. In this update you can expect to see: 

  • Over 6000 more specific sprays (branded herbicides, fungicides etc.) 
  • Over 100 more branded & generic fertilisers
  • The ability to search an item in the inputs section to quickly find your item on our system
  • Over 400 new imported organic fertility sources and the emissions from their application in different seasons and with different application methods
  • New options for agroforestry and silvopasture including a range of densities and ages of woodland
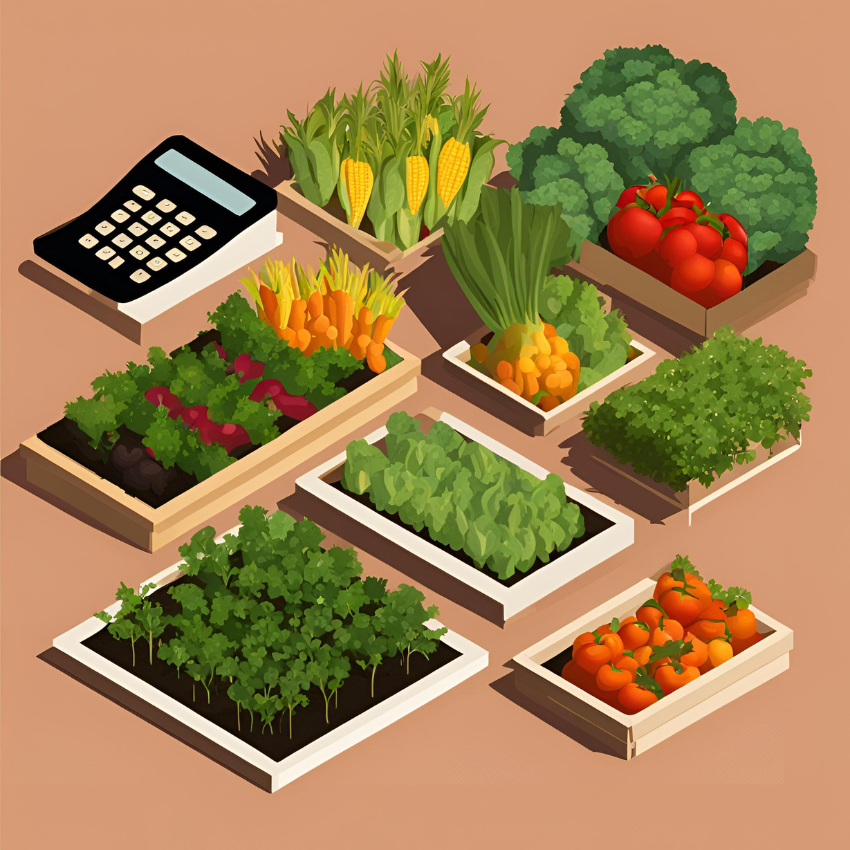
  • New options to enter market garden crops on a smaller scale 
  • New options to enter landscaping materials associated with paving and decking

For a full list of what has been added see the “What’s Changed” document, or the data collection sheets, where new Items have been flagged with a star. 

Communicating this change

If you need to communicate this article in a sentence, for example alongside your report within a supply chain, or to accompany a project you are involved in, use this:

The Farm Carbon Calculator has updated its emissions factors in line with the latest data sources – detailed information about what has changed can be found at https://calculator.farmcarbontoolkit.org.uk/resources

Further support

Contact Michael Brown at calculator@farmcarbontoolkit.org.uk


Carbon Audits in Scotland – use The Farm Carbon Calculator

Highland Cow

Thousands have already used The Farm Carbon Calculator in Scotland to generate a carbon footprint of their farm. You may be required to receive a Carbon Audit under the Whole Farm Plan guidance and be aware that the first Audits are to be completed by by 15 May 2025 – get started for free.

We’ve brought as much of the guidance you need together in one place so that farmers, growers and crofters in Scotland feel confident to get started.


Learn more in our upcoming webinar – Carbon Audit Pro

Perfect for farmers and farm professionals in Scotland looking to understand how The Farm Carbon Calculator can help deliver Carbon Audits – at any scale.

Join us online, 24 April at 4pm


Free Carbon Audits

There are around 51,000 farms in Scotland, and agricultural land makes up almost 80% of the area. Not all farms will want, or need a carbon audit, but we want to ensure as many as possible can get one for free if they want, or from a consultant, using The Farm Carbon Calculator.

In Scotland the receipt of future payments from the Scottish Government are dependent partly on the requirement that farms generate what they call a Carbon Audit – or what we term your farm’s carbon footprint. You can use several tools to complete this task – provided they meet criteria set out in the guidance and are compliant with PAS2050:

  1. The Farm Carbon Calculator
  2. Agrecalc 
  3. Cool Farm Tool
  4. Solagro (JRC) Carbon Calculator.

Useful to note, if you think you already have a carbon footprint it is likely that this will be accepted by the SGRPID. These might be delivered to you as part of a  UK supply chain contract (via the dairy, someone you supply, or supermarket agreements), by the Farm Advisory Service, as part of the Farm Business Survey, or from the Soil Association Exchange. Ask them for a copy – it’s your farm data after all and you will need this in case of inspection later.

We think there are many good reasons why you might want to do a carbon footprint but lets look first at what the benefits are as set out in the Whole Farm Plan.

What is the Whole Farm Plan?

Carbon Audits are part of Whole Farm Plan (WFP) guidance. Most farmers in Scotland are by now familiar with the WFP. It is designed encourage a comprehensive view of your farm or croft which should allow you to assess current performance, identify growth opportunities, and align practices with Scotland’s climate and nature goals.

Looking towards 15 May 2028, farmers seeking to claim Basic Payment Scheme payments will be required to implement the following key activities and plans:

  1. Animal Health and Welfare Plan – reviewed annually
  2. Biodiversity Audit – reviewed every 5 years
  3. Carbon Audit – reviewed every 5 years
  4. Integrated Pest Management Plan – reviewed annually
  5. Soil Sampling of Region 1 land – every sampled field reviewed once every 5 years.

By 15 May 2025 all farms and crofts would need to have completed 2 out of the 5 audits. For all farms, one of these must be a carbon audit. We are working to ensure your carbon audit is one of the easier tasks to complete. Check the eligibility criteria in the guidance carefully to ensure you only complete audits which are required for you, and bear in mind the guidance can change. Read more

What the Rural Payments and Services webpage looks like.

At the time of this article in March 2025 we understand that the audits required for 2026 (presumed to be required by 15 May 2026) will be made known in summer 2025 and announced as part of the Agricultural Reform Programme route map to give you time to prepare. We will revise this information as we learn more.

What we know so far is that by 2028 at the latest, all businesses will need to have all plans and audits that are applicable to their business in place.

There is lots here to take in in the above, especially if you have not undertaken any of the above activities yet. We are here to help so make sure you ask us questions if you have any.

Shows upcoming actions and milestones as part of the Carbon Audit requirements of the Whole Farm Plan

Useful links – Whole Farm Plan

Whole Farm Plan guidance can change, or be amended in the annexes and ‘guidance updates’. We recommend you also read and become familiar with the available guidance at the following links:

Find a leading free tool to help

We know navigating these requirements can be challenging, but that’s where our team steps in. The Farm Carbon Calculator is free for farmers and we’re here to provide dedicated support to farmers and crofters whilst you complete your report. You can therefore get started with the tool yourself – and take control of this part of the process. 

The benefits of a carbon footprint

If you have read this far, it is likely that you already want to get to grips with a carbon footprint on your farm. However, we understand it can be frustrating to spend more time at the computer. Here are the benefits we have hear from farmers using our tool over the past 15 years – 

You will start to benefit as soon as you begin working with our tool. The calculator is used for all sorts of reasons:

  • Boost your interest in carbon – people want to understand greenhouse gas (GHG) emissions and how they might be reduced. Combining 10 hectares once for example produces emissions of: 0.52 tCO2e, and this kind of information is readily available to you whilst you work on your report
  • Gain a unique view of your farm – often a fresh look at any business is a valuable exercise but you can also potentially make even more informed decisions
  • Create a baseline now for the future – it is likely that the earlier you footprint, the better prepared you will be for any future changes to guidance or otherwise
  • Be part of a positive narrative – more and more people are getting involved, and you can too. We think agriculture is ahead of the curve here.
  • Improve your business resilience – you may pinpoint cost-saving opportunities through resource efficiency
  • Someone asked you to – for example Meeting Carbon Audit standards as we have set out above. The Calculator is designed to be a problem solver!
Shows what information would usually be needed to carbon footprint a farm under the Whole Farm Plan Carbon Audit scheme on a croft.

Funding and support available

You will receive great advice from the Farm Advisory Service on their website, via email advice@fas.scot or telephone 0300 323 0161 to support your journey.

But you may also want assistance with the carbon audit particularly if your farm is complex, you don’t have time, or you just want someone to take care of it for you. 

There are a number of farm advisors we also support in Scotland who can help guide you through your footprint, or offer you recommendations based on your carbon audit. Check with us, or ask that your advisor uses The Farm Carbon Calculator and check their fees and the total cost to you. Email calculator@farmcarbontoolkit.org.uk to check.

If they are not sure about what tool might work best, put them in touch with us so we can offer them support. We have a range of plans available for farm consultants to use our software and give you great footprints at a low cost.

In order to receive funding for support it is usually a requirement that the advisors you contract should be Farm Business Advisory Service Scotland (FBAASS) accredited – so why not search the list available on the LANTRA website to find one near you: see list.

Receive funding for your Carbon Audit – Preparing for Sustainable Farming

We are pleased to see that funding is again available to help you under the Preparing for Sustainable Farming (PSF) programme as of February 2025. Previously it was understood that funding would be closed at this point to new applicants. 

Funding in this programme is expected to close in February 2026 and you will be able to claim for footprints completed in the 2025 calendar year. If you can claim, don’t delay in doing so. Read more

Check carefully the eligibility criteria for this funding which we have simplified slightly here:

  • £500 is available to fund eligible Carbon Audits
  • A new carbon audit can be funded every 3 years – which sits within the 5 years required for the whole farm plan
  • If you have a carbon audit but it is not of the required standard, or your farm has changed materially you should be able to make a new claim
  • Carbon audits can be claimed for that were completed in the 2025 calendar year. With claims being made by February 2026
  • When you use the Farm Carbon Calculator – either yourself, or you have a consultant prepare your audit – this should be reviewed by an FBAASS advisor and they should  give you recommendations to accompany your report that will help you reduce emissions.
  • If other funding becomes available you should not double claim.

Get started – checklist

Your Carbon Audit doesn’t have to be overwhelming use this checklist to help guide your decisions prior to getting started.

  • Get familiar with the Whole Farm Plan > read guidance
  • Check which audits are required, and by what dates > check up to date guidance. Carbon Audits are for all farms, but there may be others you would like to tackle first.
  • Check if you already have a valid Carbon Audit > if yes, you can stop here. 
  • See if you can receive funding > check eligibility
  • Decide if you want to complete the Carbon Audit yourself, or pay for help > why not create an account and login to check. You may be able to receive funded and paid for assistance either way.
  • Complete the Carbon Audit
    • Complete your own Carbon Audit > the rest of this guide will help
      • you can still send this to an advisor for recommendations 
    • Find an advisor who can help > Contact us or use LANTRA’s list.
      • check they use The Farm Carbon Calculator
      • check the cost to you.
  • Keep a copy of your Carbon Audit on file, or in our system. Should SGRPID inspect your audits you may need this to hand.
  • Ask, what next? Completing your Carbon Audit frees you up to look at other audits, but also may allow you to undertake funded soil analysis. 
    • Soil Analysis is a requirement on Region 1 farmland, and should include carbon. These results can be inputted into your report to make your footprint even more accurate. Read the WFP guidance on Soil Analysis, the PSF guidance around funding, and our very own Monitoring Soil Carbon guide too.

General suggestions

  • Most guidance suggests you should use the same carbon footprinting tool over time for consistent tracking. We’d agree – though don’t forget you can replicate, or complete a previous year in any calculator. Talk to us if you need help with this
  • Whichever tool you use, keep a good record of changes made based on your report
  • At the very least, keep a copy of your report for your records, as it is your hard work, and your data. Your Farm Carbon Calculator dashboard is a great place to keep your reports secure over time
  • Once you have a carbon audit look for or ask an advisor for actionable recommendations. You might like to start on our Farm Carbon Toolkit – a great place for guidance and case studies!
Michael Brown, Customer Service Officer at Farm Carbon Toolkit

Any questions? We’re here to help, contact Michael Brown, Customer Service Officer

Supporting Innovation in Soil Health: Our Collaboration with LandApp

At the Farm Carbon Toolkit, we’re excited to share news about our recent collaboration with Land App to support the development and launch of their new Soil Survey feature on Land App Mobile.

As part of the Agri-Carbon Kernow project in Cornwall, our team played a role in helping develop and test this tool, which is designed to help farmers and land managers record, report, and review both lab and in-field soil measurements. 

A Collaborative Effort

Working closely with the Land App team, we brought together our expertise in soil health and carbon to create a digital soil sampling solution that meets real-world needs. 

By integrating the robust soil survey methodologies we advocate in our projects into Land App’s platform, we’ve enabled farmers to gain deeper insights into soil health and carbon sequestration potential. The new feature not only helps users assess soil conditions with greater accuracy but also supports more informed decision-making for sustainable land management, as well as the evidence required for the Sustainable Farming Incentive (SFI).

The new Soil Survey feature enhances Land App Mobile’s suite of data collection tools—joining the General Data Collection survey and PTES’ Healthy Hedgerows—to provide reliable insights into soil health, which are essential for informed land management and funding applications.

Why It Matters

  • Digital Efficiency: Easily record and review soil sample data on the go, including the ability to support evidence required for SFI.
  • Sustainable Impact: Empowering better land management decisions through accurate, real-time data.
  • Collaborative Innovation: A tangible outcome of our work in the Agri-Carbon Kernow project, highlighting the benefits of cross-sector collaboration.

We’re proud to have supported Land App in bringing this feature to life and look forward to further innovations and collaborations. This includes using the Land App API to help users seamlessly manage their soil data within each platform.

Thank you to the team at Land App for their partnership—and for the opportunity to help shape tools that support sustainable land management!

Find out more

For further details and to see the Soil Survey feature in action, please refer to the Land App’s guidance.

Harmonisation of Carbon Accounting Tools for Agriculture – Webinar Replay

Watch a replay of this webinar held on the 11th September 2024 where representatives of the three major farm carbon calculators shared more details of the work they are doing together: Work to support UK agriculture to measure GHG emissions using the most up-to-date and accurate tools possible, harmonising the methodologies and outputs of their carbon calculation tools.

The three major farm carbon calculators featured in the Defra Report Harmonisation of Carbon Accounting Tools for Agriculture – SCF0129 who were Farm Carbon Toolkit, Cool Farm Alliance Community Interest Company and Agrecalc Limited – announced a collaboration earlier in 2024 by signing a Memorandum of Understanding (MOU), intended to harmonise the methodologies used in calculating the greenhouse gas (GHG) emissions from agriculture.

….. more webinar information to follow soon …..

Webinar Q&A

We received a great list of questions during the webinar event and teams from the various calculators will look to address those queries in due course.

Media contact: Kandia Appadoo (comms@coolfarmtool.org)


The Farm Carbon Calculator Update – October 2024

Farm Carbon Toolkit Team at annual field day - announcing update to Farm Carbon calcualtor

The calculator just got a little bit bigger and better

This October all calculator users will benefit from an incremental update to The Farm Carbon Calculator. We’re always looking and listening for ways to improve the tool – and in accordance with our annual development cycle we’ve added some as quickly as we can in this update.

The changes described below change our transparent methodology, and are listed in detail in an update note – read it

Image showing crops next to a simple calculator

© copyright Farm Carbon Toolkit – AI Generated

What’s new?

Calculated emissions adapt to reflect your crop management decisions

We know there are a wide range of practices around how crops are harvested or managed. Whereas before we relied on averages to calculate emissions here, now you can account for the specific way you manage each crop. The more detail you can enter, the more accurate your footprint will be.

The update applies to all crops – here’s some examples and the new ways the calculator estimates related emissions from these:

For agricultural crops like barley you can now choose from options relating to the amount of crop residue – you will see the following options:

  • Most of the barley straw left in the field
  • Half of the barley straw removed, half left in field (default)
  • Wholecrop or most of the barley straw removed from the field.

For your horticultural crops like potatoes you can also indicate what happened to residues:

  • Most of the crop residues left in field (default)
  • Most of the residues removed after harvest.

For green manures, temporary grasslands and cut forages select from the following:

  • Green manure with all residues left in field after mowing (default)
  • Forage crop with half of the residues foraged in place
  • Cash crop with all residues removed from the field.

Where you don’t have the detail to enter we revert back to a sensible default which suits the crop in question. So don’t worry – we’ve done this so the Calculator remains easy to use and crops can be entered just as before where needed.

Emissions now calculated from fruit crops

Until now the Calculator has accounted for fruit crops so yields can be recorded. Our research has reached a level of detail where we can confidently indicate emissions associated with this fruit yield – whereas before we could only account for sequestration from perennial fruit crops. 

Emissions are now calculated from the growing the fruits alongside detail on their management and their renewal rate where applicable. It is this level of detail that has allowed us to take this step – which we think greatly improves the calculator for fruit farms.

Log in to see emissions for: Blackberries, Blackcurrants, Blueberries, Cranberries, Gooseberries, Raspberries, Redcurrants, Strawberries, Apples, Cherries, Grapes, Hops, Kiwiberries, Nuts, Pears, and Plums.

Better record of the operations and activities on your farm

Accounting for fuel use and farming operations just got even easier. We’ve increased the amount of modelled emissions for different farm operations by working closely with industry professionals. 

If you don’t have all your fuel use figures but you know what farming operations you completed or contracted out, we’re confident you will be able to record this. Choose from 47 different activities like drilling, harvesting, soil preparation, bailing and much more. You’ll know the number of different types of operations needed on your farm – it’s likely that if you do it, we can help estimate emissions from it.

Here’s an example of the options now available under the general category of baling:

  • Running a bale wrapper
  • Baling by the bale – Small rectangular bales
  • Baling by the bale – Round bales
  • Baling by the bale – Heston bales
  • Baling by area ~250 Small rectangular bales per ha
  • Baling by area ~15 Round bales per ha
  • Baling by area ~7.5 Heston bales per ha
  • Baling by area (general).

More detail to capture your unique farm’s purchases and waste

More packaging can now be accounted for in your report. © copyright Farm Carbon Toolkit – AI Generated

We listened to feedback and added more options to help record unique purchases on your farm for your carbon footprint report. All farms are different so you may not see all these changes but here are the main additions:

  • There are more material items accounted for in our already extensive list; things like sheep hurdles; packaging used by dairy producers and in veg boxes; and a range of cleaning products, detergents and disinfectants
  • More items thrown away or disposed of can be simply accounted for by selecting options from our extensive list
  • If you produce your own hay and haylage this can be recorded, alongside silage and straw, feed and bedding. Following our updates to crops on-farm, this detail allows more of what you do to be recorded – though it doesn’t necessarily result in emissions calculations. You’ll find full details of what creates emissions within the calculator as you enter each item, and in our methodology and update note.

Your own feed haylage, silage, and more can be recorded in your report. © copyright Farm Carbon Toolkit – AI Generated

Better visibility of Greenhouse gas type and scope

When a report is downloaded in CSV or JSON formats you will now receive a more detailed split of greenhouse gas for each item on your report, which is also broken down by emissions scope. We’ve been asked for this from farmers and agricultural professionals using the calculator – often those reporting onward emissions to others in the supply chain looking for this detail. 

Your reports won’t change

We know consistent reporting is important to you so we have ensured carbon reports in our system will not automatically change because of this update. This means all your calculated figures will stay the same.

Do note however that if you modify an old report by adding items to it, or if you click ‘recalculate’ then your report will update in the relevant places based on this update. You may want to update it, particularly if you have crops in your report, as you may want to see changes due to the improved accuracies mentioned. 

If you want to preserve your old report but also change or build scenarios from it, you can lock your report so it cannot change and create a copy of any report from your dashboard to begin making alterations. Name these reports so you can easily tell them apart. Talk to us if you are not sure and we can advise you.

When is our next update?

These updates are scheduled to take place at least twice per year with an incremental update in Autumn and a larger annual update in Spring. 

We are here for farmers and users and our updates like this reflect all our priorities. We engage our farmer network and the Farm Carbon Toolkit team in the update process by gathering feedback on how the current version is working alongside suggested improvements. We order the feedback we receive by quality and what is achievable, and plan our next upgrade in accordance with our ongoing schedule.

We’d love to hear from you

Our friendly team can be reached to help answer your questions – talk to us.

Remember there are a range of resources for users of the Calculator and useful FAQs and videos too.

Your Farm Carbon Calculator Team – October 2024

Lizzy Parker – Calculator Manager

James Pitman – Calculator Development Officer

Grace Wardell – Calculator Development Officer

Izzy Garnsey – Data Scientist

Calum Adams – Calculator Data Assistant

Michael Brown – Customer Service Officer

Farm Carbon Toolkit – meet the team

New Calculator Updates – April 2024

The FCT Calculator team has released a significant update to the Farm Carbon Calculator, designed to ensure that your reports reflect the latest emissions data and understanding available. This update, which will affect any reports ending after 1st April 2024, encompass a range of improvements aimed at enhancing report accuracy, flexibility and calculator usability. Below are some of the main changes you will see to the calculator.

Updated emissions factors

We want to ensure that your reports align with the most recent scientific research and methodologies, and to that end we have updated our emissions factors across various categories, including: 

  • Updated UK GHG Inventory factors to the latest data (affects fuels, materials, distribution, processing, inventory and waste)
  • Updated the livestock, cropping and input emissions factors in line with the most recent IPCC standard refinements
  • Updated woodland sequestration factors in accordance with the latest Woodland Carbon Code

Numerous other emissions factors have been updated across the calculator, and for a more extensive breakdown of these changes, see Table 1 of our “What’s new for April 2024 update” document on the Calculator resources page.

New factor options

In this update we have also expanded the options available when report building to offer more comprehensive coverage of farm businesses. The new factors we have added include:

  • New fuel options such as alternative diesels and purchased heat and steam
  • Diverse new material options, such as more fencing materials, piping options, packaging choices, and agricultural consumables.
  • Expanded imported organic fertility and cropping options, including whole cropping
  • New fertiliser (including liquid fertilisers) and spray options, with provisions for unlisted items
  • Inclusion of hay and haylage as livestock feed options
  • Expanded distribution options, including electric vehicle haulage and various air freight options

Alongside adding new options, we have provided some more refined options for existing factors in the calculator, including: 

  • New managed hedgerow options, to allow reports to reflect the higher biomass accumulation of young hedges
  • We now have a non-UK electricity option for international users, allowing you to input your emissions using your nation’s specific emissions conversion factor
  • More options for structures, including new agricultural building size options and various new complete fencing options

A full overview of the new additions and refined items are available in Table 2 of the “What’s new for April 2024 update” document, as well as flagged in the new data collection sheets available on our Calculator resources page.

Accounting for Capital Items

With this update we have provided more flexibility in how capital items (such as farm machinery or agricultural buildings) are accounted for to ensure that your reports are in line with your desired reporting approach. You can choose to account for capital items in two ways:

  • Depreciating over 10 years” – The legacy method with emissions “spread” over a 10 year period
  • Upfront” – an approach which is compliant with the GHG protocol agricultural guidance. This way embedded emissions from capital items are associated with the year they were purchased, and only the emissions from your reported period will be included in your report

Not all standards require the inclusion of capital items, so if you are producing a report for someone else you should check whether they want capital items included. 

You can also switch between inventory reporting options by going to “Edit Farm Details” and you will not lose any data switching between the two.

Reporting waste

A new waste disposal reporting approach has been developed to ensure there is an accurate assessment of emission and these are accounted for in a GHG protocol compliant manner. How waste is reported can be selected on the report information page as with the new inventory options:

  • Legacy” is the existing approach which compares emissions from disposing of wastes to what would have been emitted had the waste been sent to landfill (i.e. it includes “avoided emissions”)
  • GHG protocol compliant” is the new recommended option as it discounts any “avoided emissions” and accounts just for the emissions resulting from the disposal method selected

New Data Collection Sheets

To facilitate data collection, we provide updated sheets with all new calculator items flagged for easy reference. You can find these on our Calculator resources page.

More information

For a more detailed overview of these changes and the methodologies behind them, please visit our Calculator resources page. Additionally, our website offers various help and guidance to assist you in reporting your farm businesses’ carbon footprint.

We are dedicated to providing an accurate and user-friendly carbon calculator that can help farmers improve their business and environmental resilience. This update has been the product of the hard work from our team in response to contributions and feedback from our users, so if you have any queries or insights for the calculator please email us at calculator@farmcarbontoolkit.org.uk, and we will work to make this the most accessible and informative tool for you.

How to avoid ‘double counting’ your carbon

Carbon accounting is a fast-moving space, and here at FCT, keeping on top of best practices is one of our top priorities. We commission regular external reviews of all our emissions factors to make sure we’re as compliant and up-to-date as possible. And yet even with the best data available, there’s always the possibility of human error (we all do it!) cropping up in a carbon report. 

One area we’re particularly keen to address is how to avoid ‘double counting’ when it comes to farming footprints. This refers to counting the same carbon/CO2e in different places, often (but not always) in the same report. 

For example, you might record all your freight and logistics fuel use in the ‘Fuels’ section of our Calculator, only to duplicate the entry under the ‘Distribution’ section. This would result in counting the same emissions twice, artificially inflating the total emissions figure. 

These errors can be subtle and easy mistakes to make, so it’s worth reading on to find out how to avoid them and embrace best practices.

How is double counting possible?

Our Carbon Calculator has many different emissions factors that you can record, reflecting the wide variety of needs and business profiles in modern farming. Because of the need for informative metrics and KPIs, our Calculator sometimes offers the option to record an emission or offset in more than one section. 

You can therefore choose to either record all of the carbon in one section, or to split it out for better insight in your final report. For example, you may want to be able to see the amount of fuel used in farming operations vs. the fuel used in the distribution of goods. Being able to record the carbon in more than one place is crucial to business insight, but it does introduce the risk of error. 

If we want to use these informative metrics, then it’s important to be aware of when you might double-count your carbon. 

Where in the Calculator might I be double counting?

We’ve listed below some of the most common areas where double counting may occur in our Calculator. For each one we’ve given an example of how it occurs, and the best practice in order to avoid it. 

Animal Feeds – Home grown vs. Bought in 

If you are growing your own animal feed on-farm, then you don’t need to account for this in the ‘Livestock’ section. To do so would overestimate your emissions. The Livestock section is only for feeds that are specifically bought in.

To avoid the double count: Make sure that anything recorded as a feed in the Livestock section is a bought-in feed. If not, it doesn’t need to be counted there!

Materials vs. Inventory

The Materials section of our Calculator allows you to record a wide variety of items that are used in construction and repair work. Our Inventory section, on the other hand, is there to record larger capital items such as new outbuildings or farm machinery. This difference is key, as any items within the Inventory section will have their carbon impact depreciated over a period of 10 years.

It’s also possible to record your own custom building projects inside the Inventory section. For example, you might choose to record all the materials associated with a new outbuilding. This might be done so that you can achieve a more precise footprint for a non-standard construction. 

Where materials are purchased for running or regular repairs of existing installations, record these in the Materials section.

To avoid the double count: Make sure you’re not recording any custom-build projects in both Materials and Inventory. They only need to be recorded in one of these sections!

Sequestration – Double Counting Offsets 

If you have previously sold any carbon offsets, for example through soil organic carbon sequestration, then you should not count the offset in your report. To do so would be an example of double counting as the benefits are no longer attributable to your farm business. 

To avoid the double count: Make sure you’re only recording potential sequestration that hasn’t been sold or accounted for elsewhere. 

Sequestration – Double Counting potential sequestration

If you have entered an area of land under the sequestration option: “Soil Organic Matter” or “Soil Organic Carbon” (using information from soil sampling), you should not also enter those areas of land under other sequestration options (such as Countryside Stewardship Schemes, even if the land is receiving payment for that scheme). Direct soil sampling is preferable in this scenario. Similarly, whilst in practice you can “stack” the payments you receive from stewardship grants, you must only enter areas of land for sequestration under one potential sequestration option (so if “My field” is 5ha, I can enter soil sampling data from those 5ha OR the fact that they are under a Countryside Stewardship Scheme).

To avoid the double count: Include each field area under only one potential ‘Sequestration’ option.

Fuel Use – Distribution vs. Farming Operations 

If you want to split out your fuel use into distribution and farming operations, you have the option to record these separately. Any farm fuel use such as red diesel can be recorded under ‘Fuels’. Any fuel used in moving goods can be put under ‘Distribution’. 

To avoid the double count: We recommend splitting out fuel use between ‘Fuels’ (i.e. farm operations) and ‘Distribution’.

The Exceptions

As with all good rules, there are some apparent exceptions:

  • you CAN add multiple crops that have been grown on the same area of land in the same year (but only include those that have been harvested or terminated within the reporting period). 

Free-to-Use Equine Carbon Calculator

Taking The Reins: Equine Carbon Calculator Launched to Inspire Environmental Action

A consortium of equine organisations is rallying the industry to play a leading role in addressing the climate crisis and shaping a better future, with the launch of the first nationwide equine carbon calculator today.

Pioneered by equine environmental sustainability specialists White Griffin and the Farm Carbon Toolkit, in partnership with Derby College Group, Hartpury University and Sparsholt College Group, the calculator has been developed to empower equine businesses and horse owners to better understand their environmental impact and take meaningful steps to mitigate it.

The free-to-use tool – accessible here – also identifies opportunities for businesses to minimise their energy costs and maximise their potential to regenerate the countryside.

While carbon footprint tools are prevalent in the agricultural sector and play a pivotal role in government carbon reduction targets, no such tools have been available at scale for equine premises until now.

Without insights into the scale of the challenges and opportunities, the equine industry is hindered in setting meaningful targets. The equine carbon calculator seeks to bridge this gap, empowering stakeholders to make informed decisions for a sustainable future.

Director of White Griffin, Ruth Dancer said:

“The equine community holds a deep connection to the natural world, so we have a unique opportunity to safeguard it for future generations. By implementing the equine carbon calculator, we can better understand our emissions and find innovative ways to reduce them, saving money and paving the way for a better future.”

The launch of the carbon calculator marks the beginning of a comprehensive campaign to educate and inspire the equine industry on environmental sustainability. This initiative will be complemented by a suite of resources set to launch in autumn, offering support to stakeholders across the horse racing and equestrian sectors.

It follows a broader industry shift toward a more sustainable future for equestrians and horse racing, underscored by the tangible impacts of climate change on the industry. Following the hottest year on record in 2023 coupled with significant flooding, the UK equine industry suffered multiple cancellations across the full spectrum of events, highlighting the urgency of addressing these challenges. 

White Griffin’s previous reports for the British Horse Racing Authority and the British Equestrian Federation, have laid strong foundations for these sustainability initiatives, emphasising the need for tools and resources to support businesses in their sustainability efforts.

Farm Carbon Toolkit project lead, Lizzy Parker said,

“After years of supporting agricultural farms with reducing their environmental impact through a clear and easy-to-use tool, we know how important measuring to monitor is. Our calculator allows equine businesses to properly understand their carbon footprint and make the necessary changes to reduce their emissions.”

The equine carbon calculator is the result of a collaborative effort among academic institutions committed to driving real change in the industry.

The project began when Assistant Principal of Derby College Group, Jon Collins, began work on their own carbon footprint and discovered that while the tool had everything they needed to understand the farm’s footprint, they struggled to use it for their equine yard. Speaking with Sparsholt College Group and Hartpury University, Collins discovered that both organisations were also seeking to develop a tool to support their equine students and businesses and therefore a collaboration was formed in order to pool resources. Collins said,

“I chose Farm Carbon Toolkit to develop the resource because I found their tool to be easiest to use and provided the best user experience. Understanding the busy lives of equine business owners, we knew that we had to develop something that was clear, useful and also provided invaluable insight and comparisons with other equine businesses. We are proud to be delivering this with the support of Landex and will be rolling the tool out to all students, organisations and interested individuals who are seeking to make a difference in their day to day lives to the environment we all depend on.”

Project lead for Hartpury University, Rachel Collins, said: “We’re passionate about sustainability at Hartpury and have worked with both White Griffin and Farm Carbon Toolkit to deliver the most up-to-date training and knowledge to our students on equine sustainability. This tool represents an important step in our commitment to drive the industry forward towards a sustainable future. We are proud to be part of this collaboration, leveraging our expertise to empower stakeholders and effect meaningful change.”

Mark Treagust, Vice Principal of Sparsholt College Group said: “Collaboration within the equine sector is vital to address our industry’s greatest risk – the climate crisis. Leveraging our collective wealth of knowledge in land management and equine welfare, we must support businesses in making impactful changes. This tool initiates a large-scale process for thousands of individuals all over the country. By uniting as academic institutions and utilising the Landex network, we can effect real, much needed change.”

Farm Carbon Calculator External Review Completed

Farm carbon calculator logo

By Liz Bowles, Farm Carbon Toolkit Chief Executive

Having confidence in the accuracy of the Farm Carbon Calculator

In a recent blog post, we explored all the factors that influence the accuracy of carbon footprint, from the data the user inputs, through to the processes that ensure the Farm Carbon Calculator’s calculations and emissions factors are correct, and the ongoing testing carried out. However, like any good service, we understand that you want independent experts to endorse our tools.

Feeling confidence from external experts

Like any good service provider, we actively and regularly seek external review of our tools. In autumn 2023 we asked the independent global climate consultancy, the Carbon Trust to review our Calculator, including the methodologies, calculations, assumptions and factors that underpin a working calculator against the GHG Protocol standards. Following this review, we have developed an Action Plan to address issues identified which will be completed by December 2024.

Alongside this work, Defra commissioned ADAS to look at a number of leading UK Carbon Calculators to improve our understanding of the differences between them and to support methodology harmonisation going forward.Our Calculator was one of those included in the comparison. A key finding from this work was that although there are many ways to complete a carbon footprint inaccurately there is no “one way” of doing it accurately. This is mainly because the different Calculators compared are seeking to answer slightly different questions.

The differences identified were found in the areas of scoping, emissions factors used and standards aligned with

Scoping describes what is measured, and some calculators include things that others don’t. At the Farm Carbon Calculator, for instance, we measure as much as possible of a farm business. This includes, for instance, the embodied energy in buildings and machinery, upstream emissions of various inputs, and gives the option to estimate all potential carbon sequestration on farm. Not all calculators go this far.

There are some standard and some non-standard emissions factors used. For instance, the UK Government produces a comprehensive list of emissions (UK GHG Inventory & Conversion Factors) from fuels and energy, livestock and crops that all calculators will use. But some of the other factors come from a range of other scientific papers and there may be some variability in which ones are used by different calculators. All calculators currently carry out their own research independently of each other.

The UK Department for Energy Security and Net Zero publishes annual updates to emission factors

There are a number of standards that describe what and how to measure carbon footprints. Whilst there are a number of standards that relate to food and farming, there is a lack of consensus over which standard is ‘the one’ to adhere to. We are therefore implementing a process whereby users can choose to align their carbon reports to one of a few recognised standards. This will be available in due course.

You can find the full report and recommendations in the ADAS Report for Defra.

Following this report, we are working actively to support higher levels of harmonisation where this is possible to reduce results variability from different Calculators. 

Hopefully, this gives you, our valued users, confidence that we are rigorous in our processes, that we conduct regular independent reviews, and that we are fully engaged with industry, Government and reviewers to improve and meet the expectations of a maturing sector.

As an organisation that exists to help farmers and growers measure, understand and reduce their carbon footprint,  we always operate in the best interests of our users which includes ensuring our Calculator is as accurate as possible at all times. We are independent, providing a free carbon calculator for farmers and growers, and have a process of continual improvement in place. As a regular user of our Calculator, you can always compare current and past results using the most up-to-date Calculator, allowing you to track business progress to net zero.

You can find all you need to know about the Farm Carbon Calculator here. If you need more information please contact us at calculator@farmcarbontoolkit.org.uk or phone us on 07541 453413.

Building trust in Carbon Calculators in Agriculture

Farm carbon calculator logo

By Liz Bowles, Farm Carbon Toolkit Chief Executive

In a recent blog post, we explored all the factors that influence the accuracy of carbon footprint, from the data the user inputs, through to the processes that ensure the Farm Carbon Calculator’s calculations and emissions factors are correct, and the ongoing testing carried out. Here we would like to tell you about how we are involved with activity to support Calculator harmonisation to increase levels of trust in all UK Farm Carbon Calculators.

Defra is very keen to support the agricultural sector in embracing greenhouse gas accounting. To this end in 2023, they commissioned ADAS to look at a number of leading UK Carbon Calculators to improve our understanding of the differences between them and to support methodology harmonisation going forward. Not surprisingly the differences between the Calculators investigated arise from three main areas – scoping, factors and standards.

Scoping describes what is measured, and some calculators include things that others don’t. At the Farm Carbon Calculator, for instance, we measure as much as possible of a farm business.

There are some standard and some non-standard emissions factors used. For instance, the UK Government produces a comprehensive list of emissions (UK GHG Inventory Conversion Factors) from fuels & energy, livestock and crops that all calculators will use. But some of the other factors come from a range of other scientific papers and there may be some variability in which ones are used by different calculators. 

There are a number of standards that describe what and how to measure carbon footprints. Whilst there are a number of standards that relate to food and farming, there is a lack of consensus over which standard is ‘the one’ to adhere to.

Guidance for all carbon calculators

A series of recommendations for all Carbon Calculators, Industry and UK governments were made by ADAS as a result of this work – ADAS report . Here we list those recommendations and how we are implementing them.

SectorWhat is the ask?What is FCC doing?
Industry and GovernmentClearly define the scope required for farm level carbon assessments and how they will be usedWe are actively working with industry bodies to harmonise the way emissions data is collected and calculations are made
CalculatorsAlign with the requirements of the latest standards and guidance – currently GHG Protocol standardsFollowing our Carbon Trust Review we are implementing our agreed action plan to ensure full alignment with the GHG Protocol
CalculatorsRegularly review and update Calculators to account for changes in scientific knowledge, carbon accounting methodologies and new emission factorsWe update the Calculator in spring and autumn each year, covering all three areas outlined in the recommendation
CalculatorsComply with the latest IPCC guidanceWe already adhere to IPCC guidance
CalculatorsTo use emission factors from agreed sources for the embedded emissions in fertilisers, feed and fuelsWe base emissions factors on the GFLI database, which is considered the most robust source of this data. However, we would welcome a more UK-centric database which is required to be used by all Calculators. Agricultural carbon tools have been struggling with the challenge of embedded emissions in purchased livestock for years
IndustrySupport the development of appropriate emissions factors for the embedded emissions in purchased livestock
CalculatorsPresent outputs in compliance with the latest standardThrough our adoption of the Carbon Trust Recommendations our outputs will align with the latest standards
Government and industryDefine consistent disaggregated output categories for use by all calculators.(not applicable)
Calculator providersBuild user confidence through transparency of approach and third-party verification of the alignment of calculators to minimum standardsOur methodology is freely available on our website and we annually carry out an independent review of the Farm Carbon Calculator

Alongside the work of ADAS, FCT is working with other UK Calculators as well as industry bodies such as Dairy UK to support more rapid harmonisation to reduce report results variation for farmers. Watch this space!

As an organisation that exists to help farmers and growers measure, understand and reduce their carbon footprint,  we always operate in the best interests of our users which includes ensuring our Calculator is as accurate as possible at all times. We are independent, providing a free carbon calculator for farmers and growers, and have a process of continual improvement in place. As a regular user of our Calculator you can always compare current and past results using the most up-to-date Calculator, allowing you to track business progress to net Zero.


You can find all you need to know about the Farm Carbon Calculator here If you need more information please contact us at calculator@farmcarbontoolkit.org.uk or phone us on 07541 453413