Category: Calculator

Carbon Trust Reviews FCT Calculator

Our role in helping to decarbonise agriculture brings many challenges, not least making sure that our underlying data and methodology are the best they can be, aligning with the latest science. We’re always striving to improve this, which is why, every year, we conduct an independent review of our Calculator to ensure we’re giving the most robust agricultural carbon footprints possible.

This year, the review of our Calculator methodology was conducted by the Carbon Trust and we’re pleased to be able to share their findings and keep our users updated as we update the Calculator in response.

Summary of the Carbon Trust Calculator Review

In October 2023, The Carbon Trust conducted an independent review and gap analysis of the Farm Carbon Calculator against:

  • The GHG Protocol standard (GHG Protocol);
  • The WRI Land-Use Change and Removals Draft Guidance (WRI LSRG);
  • SBTi Forest Land and Agriculture Guidance (SBTi FLAG)

The following aspects of the Farm Carbon Calculator were covered by the review:

  • User interface
  • Quality Control procedures
  • Emissions factors
  • Calculation methodologies
  • Approach to land-use change

The review identified several strengths and areas for improvement to support the alignment of the tool with the above standards and guidance.

The Carbon Trust has received a detailed action plan of how FCT will enact these recommendations over the next 12 months (with the majority of improvements scheduled for release in April 2024). The Carbon Trust considers that the action plan addresses the points raised in the review. 

Scenario Planning In The Farm Carbon Calculator

At Farm Carbon Toolkit, we know that planning for the future is vital to any business. That’s why we’ve been working hard to create a more formalised system of scenario planning in our Farm Carbon Calculator. And today we’re excited to unveil the new beta version of this functionality, which will give growers and those in the supply chain key insight into the management of their business.

While it was previously possible to scenario plan in the Calculator, we’ve built brand new functionality that makes the entire process clearer and simpler to steer you towards achievable actions.

Scenario Planning In The Calculator

When planning for the future, it helps to be able to visualise the changes you want to make. Scenario planning can help you to plot a roadmap for your business, and see the impact that operational changes could have on your carbon emissions.

Here is a rundown of all the new scenario planning functionality in the Calculator, and how you can use it for key insights into your business.

Report Types

In order to make scenario planning easier and clearer, there is now a ‘report type’ option in the Calculator – which will make it clear if the report you’re looking at is a standard report, a test, or a scenario plan. It also helps us filter out scenario plans from our benchmarking datasets.

Creating Scenarios

There is now a ‘Scenarios’ button on the report results screen, which will bring up several options when you click it (see the screenshot below). When you’ve finished a report, use the ‘Scenarios’ button to start building your plan for reducing your footprint or explore how you could improve the sequestration potential of your farm.

Presets

Firstly, you’ll be able to choose preset scenarios that let you see the effect of changing business parameters. The presets are:

  • Reducing red diesel usage by 10%
  • Switching to a 100% renewable energy tariff
  • Reducing fertiliser usage by 10%

Selecting any or all of these options, and then clicking ‘Create Scenario’, will create a scenario based on the criteria you’ve chosen. You can also leave the presets blank, and just click ‘Create Scenario’, in order to build your own customised scenario plan building on the data you entered in your original report.

N.B. In time, we intend to make more preset options available – but the scenarios above represent fairly typical changes that many growers look to make, and so offer a useful starting point.

Editing Your Scenario Plan

Once you have created a scenario, you’ll need to click ‘Edit farm details’ on the report page so that you can edit the date your scenario plan applies to.

Setting the date is important for our timeline and comparison views, which you can use when you’re ready to see the effect of your scenario planning.

If you’re building a scenario yourself, or want to change some details on a preset, then simply click ‘Edit data’ in the report results screen. Here you can make any changes you want in the same way as in a standard report.

Comparing And Visualising Scenarios

There are two ways to access a report comparison – the first is through the ‘Scenarios’ button in the report results page – from here, you have ‘Scenario comparisons’ and ‘Scenario timeline’ options. These buttons will take you to the relevant comparison type – more on that below – for any scenarios associated with the report you’re working on.

Alternatively, you can also access comparisons by clicking ‘Dashboard’ and then selecting the ‘Comparisons’ sidebar button. From here, you’ll need to select the reports you want to compare – note that linked reports and scenarios appear next to each other automatically. Finally, select either the ‘Timeline’ or ‘Compare’ option – we’ll dive into what each of these options mean next.

Comparison Types – ‘Timeline’ And ‘Compare’

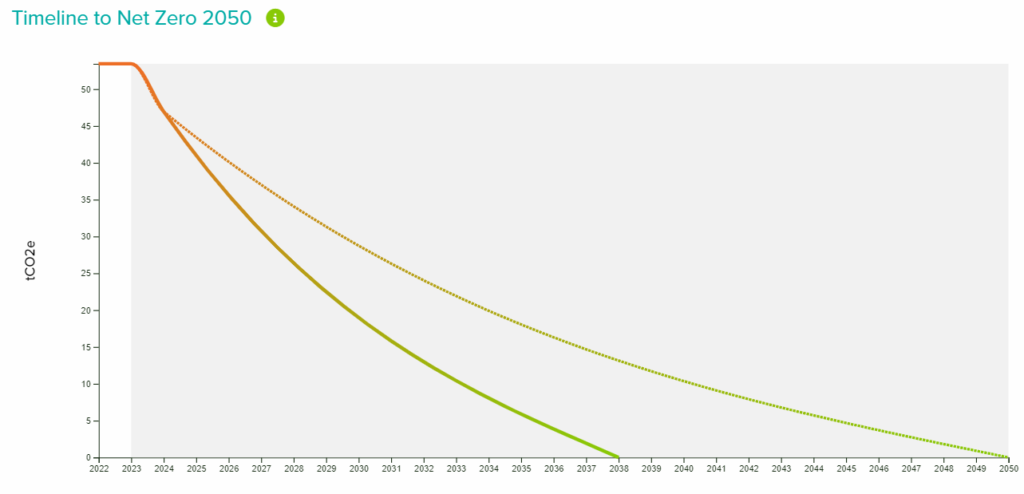
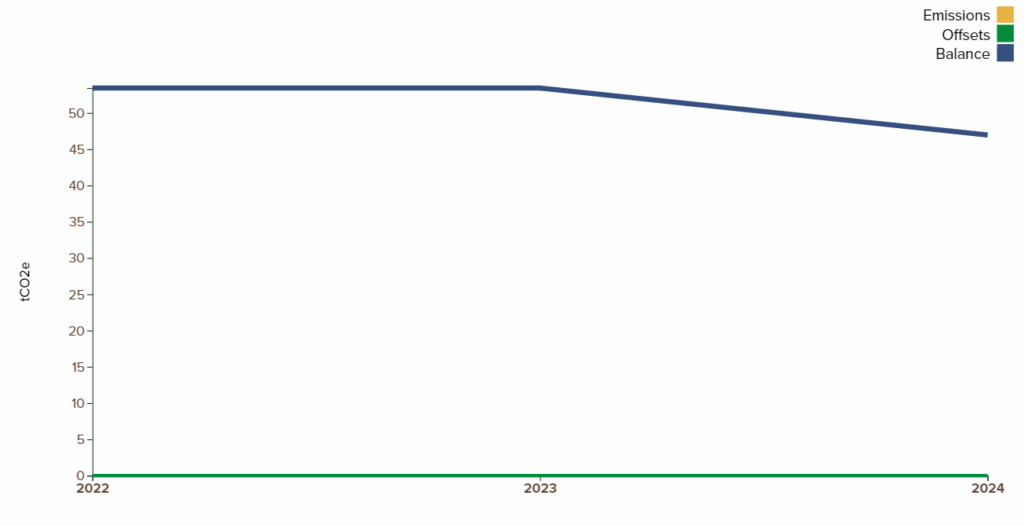
Our Timeline and Compare views offer two different ways of visualising your data. In the simplest terms, ‘Compare’ shows you key metrics and KPIs in a tabular format, while ‘Timeline’ shows your progress over time and towards a net zero target date (2050 by default).

If you want a detailed, granular view of your business, emissions and sequestration, then it’s best to use the Compare view. If you are looking for an overview and direction of travel, you’ll probably prefer the Timeline view.

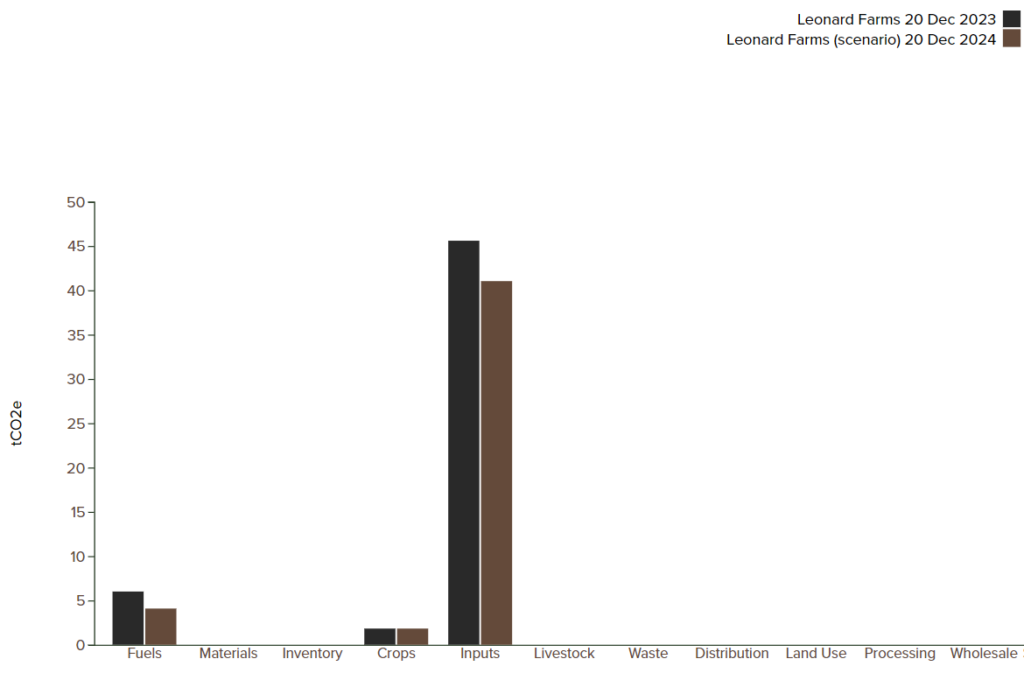
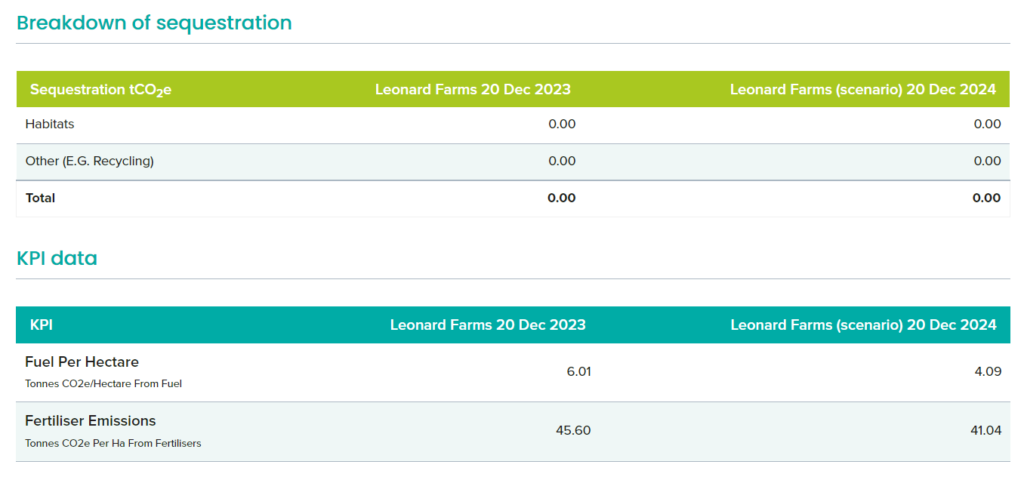
Click through the image gallery below to see some examples of the ‘Compare’ view data.

And below are some examples of what the ‘Timeline’ view will show you.

Future Development

We’re excited to see how scenario planning will help businesses to reduce emissions and achieve their targets. Looking forward, in 2024 we’ll continue developing the Calculator, and as always our focus will be on helping farmers and businesses both track and reduce their carbon footprint.

You can always get in touch with us to find out more or let us know what you need from the Farm Carbon Calculator calculator@farmcarbontoolkit.org.uk.

Introducing New Benchmarking on the Calculator

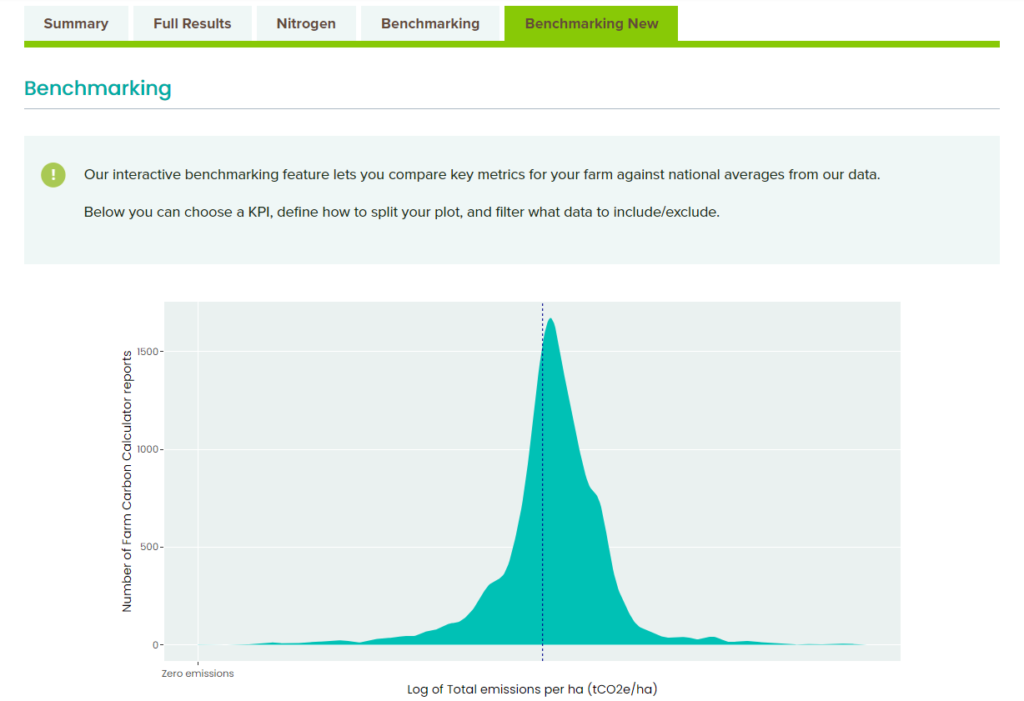
Benchmarking graph

In recent weeks we’ve been working hard to revamp the benchmarking functionality in the Calculator. Today, we’re pleased to unveil a new beta version available for all of our users. Featuring an interactive graph and all-new metrics, you can now gain even more insight into how your business is performing. 

The existing benchmarking function will remain in the Calculator for the time being, while we gather feedback on the new version. You can access the new benchmarking function from the ‘View results’ section of a report.

Chart showing user's total emissions per ha compared to farm carbon benchmarking data from Farm Carbon Toolkit

New Benchmarking Explained

Our new benchmarking feature allows you to see how you compare against data from our Farm Carbon Calculator users going back to 2020. Currently, you can dig into 5 key metrics on the benchmarking page – these are:

  • Total emissions per hectare (tCO2e/ha)
  • Total crop yield (tonnes/ha)
  • Total emissions per tonne crops (tCO2e/tonne)
  • Total emissions per tonne liveweight sold (tCO2e/tonne)
  • Total emissions per tonne FPCM (tCO2E/tonne)

Configuring Your Benchmarking Plot

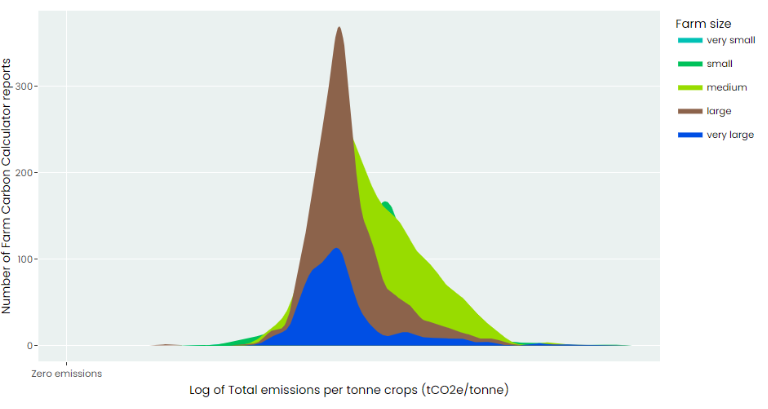
Once you’ve chosen which KPI to look at from the drop-down menu, you can also choose a category to split the plot by. You can do this by farm type, farm size, region and reporting year. 

Chart showing distribution of total emissions per tonne of crops for farm carbon benchmarking data from Farm Carbon Toolkit, split by farm size

Filtering The Data

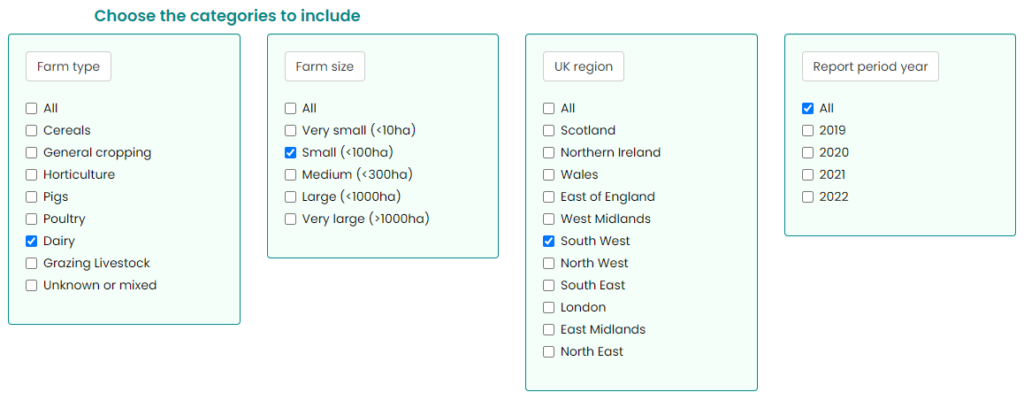
Lastly, you can also filter the category, if you want to include or exclude certain data. By default, all categories are included but you can choose which data to focus on via the check boxes.

For example, if you are a small dairy farm in the South West, you may wish to only check boxes for “Dairy”, “Small (<100ha)”, “South West” in order to compare with similar types of farm.

Tickbox options for splitting farm carbon benchmarking data in the new benchmarking feature

Interpreting Benchmarking Data

In order to make benchmarking data easier to interpret, we used what’s called a ‘log transformation’ to be able to fit the range of data we hold into a simple graph. It is not easy to read the absolute value for a farm from the axis but it gives you a picture of the spread of the data so that you can see how your farm compares to others.

When you have data in your report to be able to calculate one of the key metrics, you will see your report’s value on the chart as a blue dashed line.

Rule of thumb: if your blue dashed line is towards the left hand side of the peak on the chart, you are doing better than most, while if it is to the right hand side of the peak, you may be doing less well for that metric.

Chart showing user's total emissions per ha as lower than average
Chart showing user's total emissions per ha as higher than average

What’s Included In Your Benchmarking Data?

The data for the new benchmarking feature comes from our own user-generated reports. This data has been carefully managed so as to exclude – among other things – duplicate values, outliers and test scenarios.

For example, reports for farms that have an area greater than 50,000 hectares, but no emissions or sequestration value, will be excluded from the result set. We will also exclude report names with fewer than 3 characters, or those whose names obviously mark them out as test scenarios.

Once any exclusions have been made, we perform some (minimal) cleansing of the remaining data. We may, for example, infer a ‘region’ value from the farm’s postcode. Or infer a reporting year based on the submission date (where there’s no other information available). Finally, we perform the log transformation explained above, in order to display the information in the most user-friendly way.

While every effort is continually made to validate and verify the underlying data, it’s worth keeping in mind that it will never be completely flawless. Nevertheless, the data is very robust and can help aid in planning and decision-making for your business.

What’s Next?

Our carbon Calculator is regularly updated with new features, emissions factors and general improvements. We will continue this work into 2024, and are excited to see how these changes can enhance carbon reporting for farmers and businesses. We plan to update the farm carbon benchmarking data available annually.

Product footprinting for farms and supply chains event at Houghton Hall

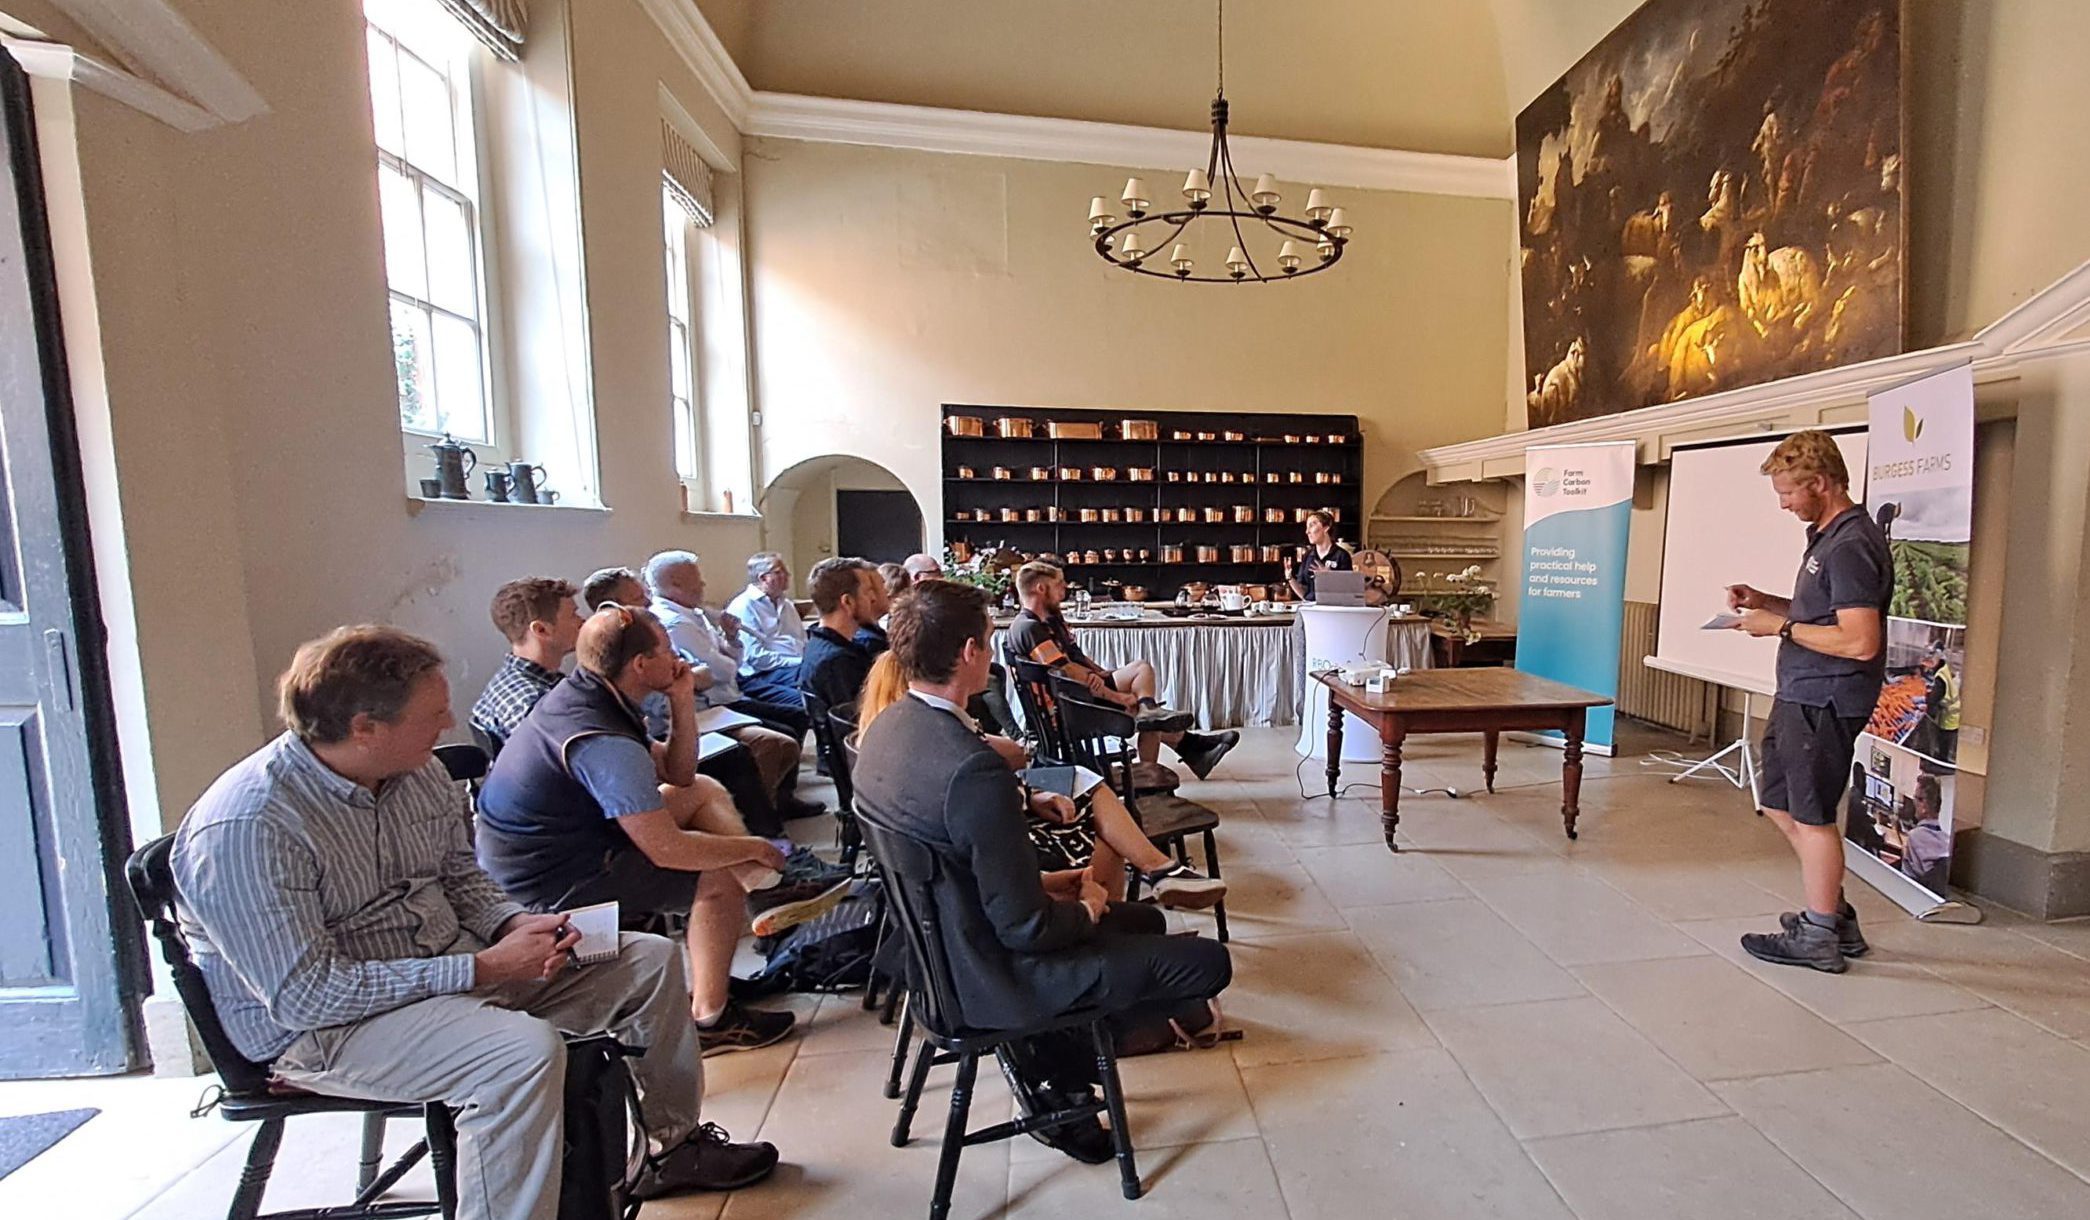
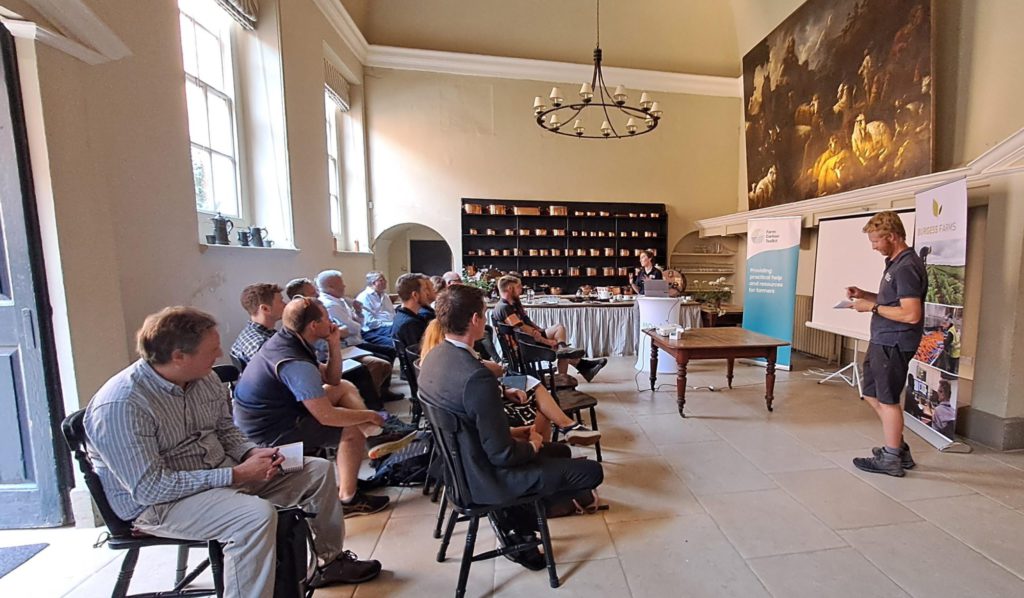
Lizzy Parker and Jonathan Smith (Farm Carbon Calculator) answer questions from growers, processors, estate managers and retailers on the new supply chain carbon footprinting tools available from the Farm Carbon Calculator, during a showcase at Houghton Hall, Norfolk

Press release: 29th September 2023

New tools to footprint farm products along supply chains

Growers, processors and retailers met at Houghton Hall in Norfolk on 8th September 2023 for a showcase of new tools for carbon footprinting of whole supply chains that ultimately allow retailers to track their detailed scope 3 emissions.

These new tools are the latest improvements to the Farm Carbon Calculator, one of the industry’s most popular carbon calculators, which enables farmers and growers to measure and understand the carbon footprint of their business.

Lizzy Parker, Carbon Calculator Manager said:

“We have developed software that, with very little change to the way farmers use the existing Calculator, permits users to produce a product footprint from their whole farm footprint and then pass that information through to their customers. Within the tool, and using the same methodologies, the customer (for example a processor like RB Organic) can aggregate those product footprints from all their growers and add on their own business’ emissions to produce their own product footprint, which can in turn be passed further along the chain.”

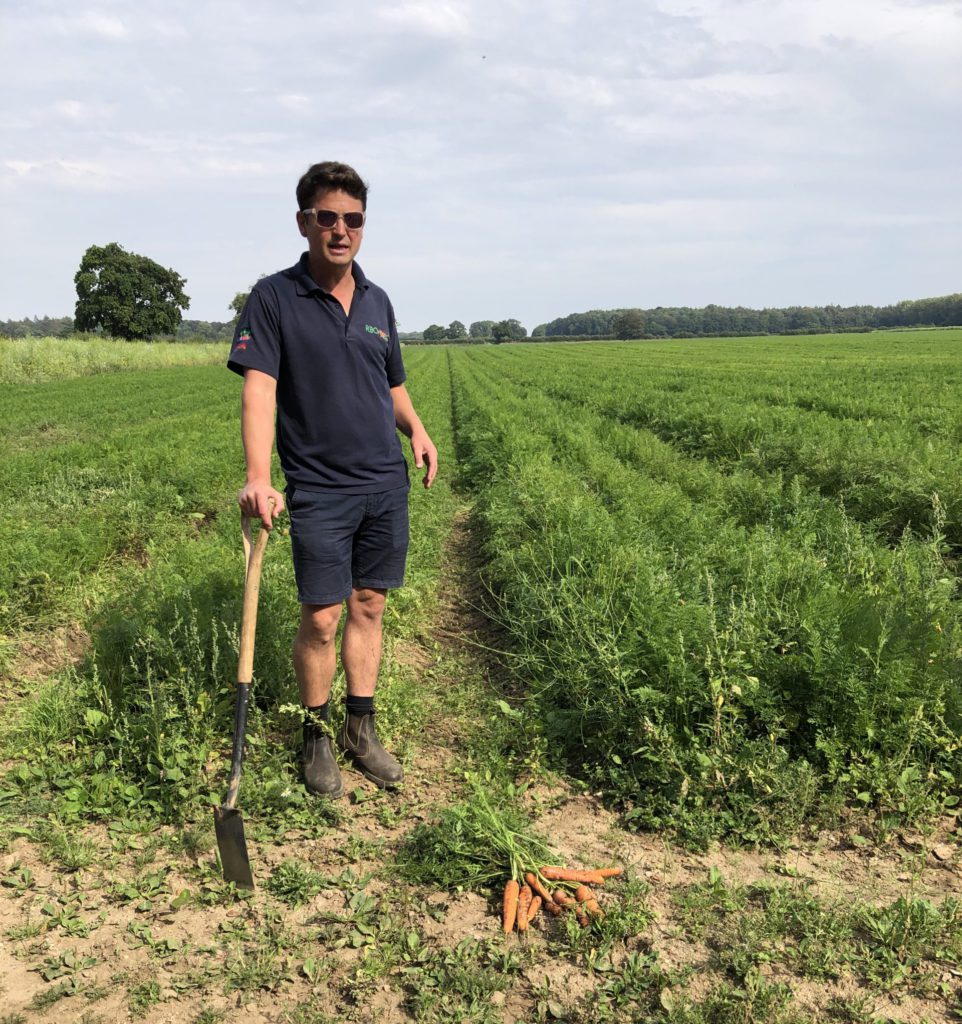
Jonathan Smith (Farm Carbon Calculator) discusses management practices that can reduce the carbon footprint of carrot production with RB Organic suppliers and growers on the RB Organic managed land, Houghton Estate, Norfolk.

In the race for farmers and growers to reach net zero carbon and beyond, the Farm Carbon Calculator is focussed on providing the best tools to enable them to measure and manage carbon in their businesses. Working with RB Organic, part of Burgess Farms and their organic carrot supply chain, has enabled the team at the Farm Carbon Calculator to develop the tools with the input of a range of growers, suppliers and logistics companies, as well as the retailer, so that the process works for everyone involved.

Melissa Goodman, Head of Group Compliance at Burgess Farms, said: 

“Identifying our Scope 3 emissions in our supply chain will help us advance on our net zero journey. Developing additional tools that can provide a greater insight into emissions will not only deliver substantial benefits to our business but for the environment too in tackling climate change”.

One key development to enable UK supply chain footprinting has been to research and build an International version of the existing Calculator that can feed into the same carbon reports. Most food products on UK supermarket shelves have dynamic supply chains that rely on imports for parts of the year. Agronomists in Italy, working with RB Organic’s Italian carrot growers, supported the appropriation of the Calculator so that the tool can now provide both language translation and regional data for Italy, crucial for the footprinting of this fresh produce supply chain. 

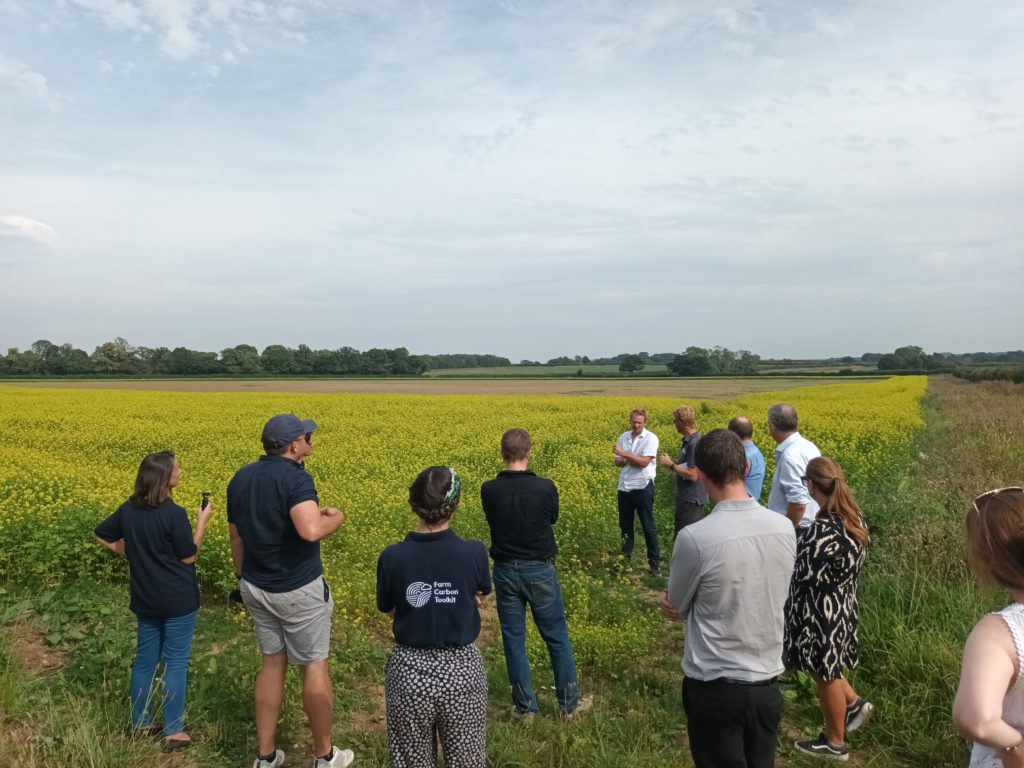
Chris Negus, General Farm Manager for RB Organic, leads a tour of the organic carrot production on land at the Houghton estate, Norfolk and describes how management practices feed into the company’s carbon footprint in the long term.

The tools are currently in beta testing with existing supply chain partners of the Farm Carbon Calculator and any organisation wishing to use them can contact the team at calculator@farmcarbontoolkit.org.uk for more information.

The development of these tools for the Farm Carbon Calculator and the footprinting of RB Organic’s carrot supply chain has received funding through the Innovation Connections programme, which is a Tesco WWF partnership initiative.

Paul Marsh, Climate Change Specialist at WWF, said:

“The clock is ticking when it comes to taking action to address the climate and nature crises. Driving down harmful greenhouse gas emissions from the agriculture and land use sector is vital if we are to avert climate catastrophe. We welcome efforts to improve the tools available to UK farmers to measure, monitor, and mitigate emissions over time, and enable the flow of carbon data across supply chains. This can play a key role in supporting the sector to drive down its climate impacts, as part of a shift towards a sustainable food system.”

ENDS

Notes for editors

  1. The Farm Carbon Calculator is owned and managed by Farm Carbon Toolkit, a Community Interest Company dedicated to helping farmers and growers understand and reduce their carbon emissions for the past 13 years.
  2. Farm Carbon Calculator can be found here https://calculator.farmcarbontoolkit.org.uk/
  3. Farm Carbon Toolkit has received funding through the Tesco WWF Partnership Innovation Connections Programme: https://www.tescoplc.com/tesco-and-wwf-announce-winners-of-innovation-accelerator-programme/ 
  4. For press enquiries related to the Farm Carbon Calculator please contact Lizzy Parker, Calculator Manager at calculator@farmcarbontoolkit.org.uk 

Using the calculator: focus on fertiliser use & efficiency

This month we’re focusing on how we account for emissions from fertilisers in our Farm Carbon Calculator.

Inorganic fertilisers can be entered in the Calculator using the “Inputs” tab and selecting either a “specific” (branded) or “average” product. The branded products included on the Calculator are those for which the manufacturers have been able to provide us with a robust carbon footprint or where they have communicated the formulation and country of production for the fertiliser ingredients so that we can estimate the carbon footprint for users. 

The “average” options ask you to select the region of the world that the fertiliser was produced in, which you can see from the chart below has a big impact on the total carbon emissions associated with fertiliser use. European produced fertilisers tend to have lower embedded emissions because the factories producing them are fitted with emissions abatement systems.

The Calculator takes the quantity of fertiliser and uses emissions factors (from Brentrup et. al 2016) to work out the embedded carbon associated with that quantity of the fertiliser (i.e. the carbon emitted as a result of producing it) and then also estimates the CO2 equivalent of:

  • the nitrous oxide (N2O) emissions in the soil associated with applying that quantity of fertiliser
  • indirect ammonia (NH3) losses to the air due to volatilization
  • emissions associated with urea hydrolysis (only for fertilisers containing urea)

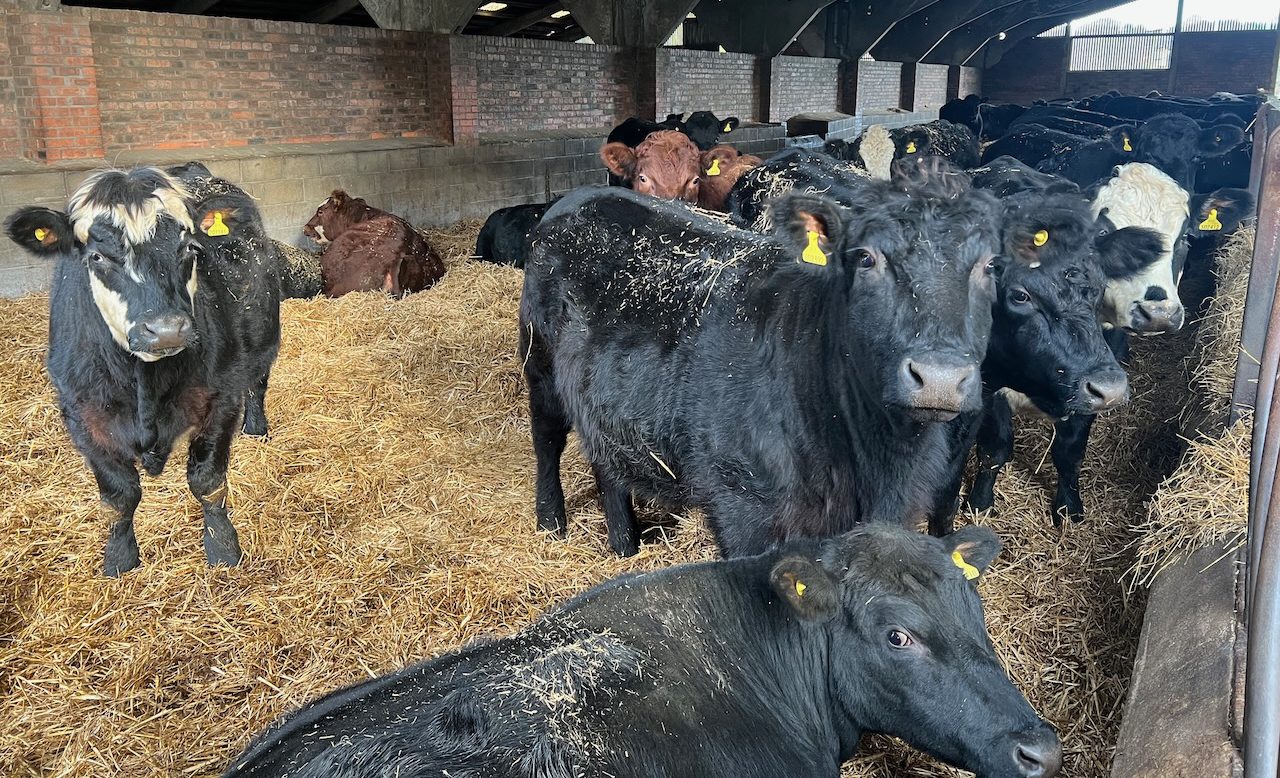
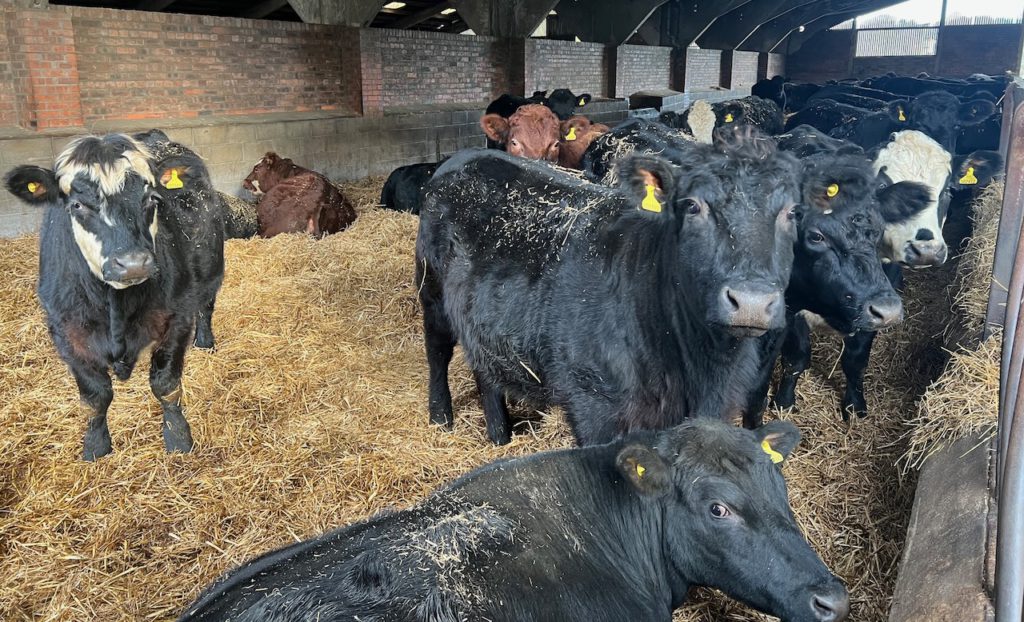
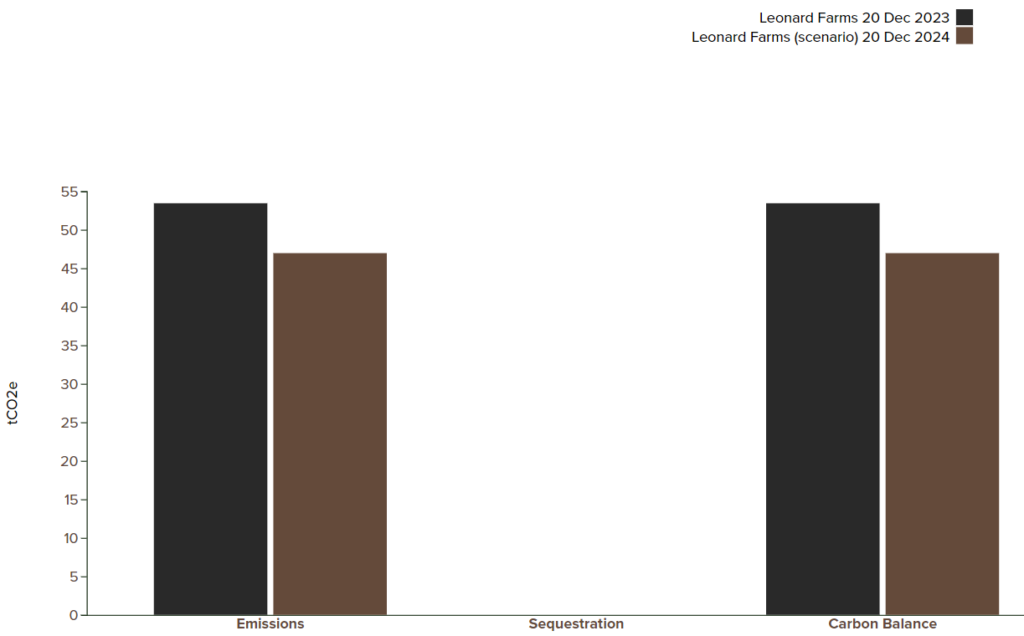
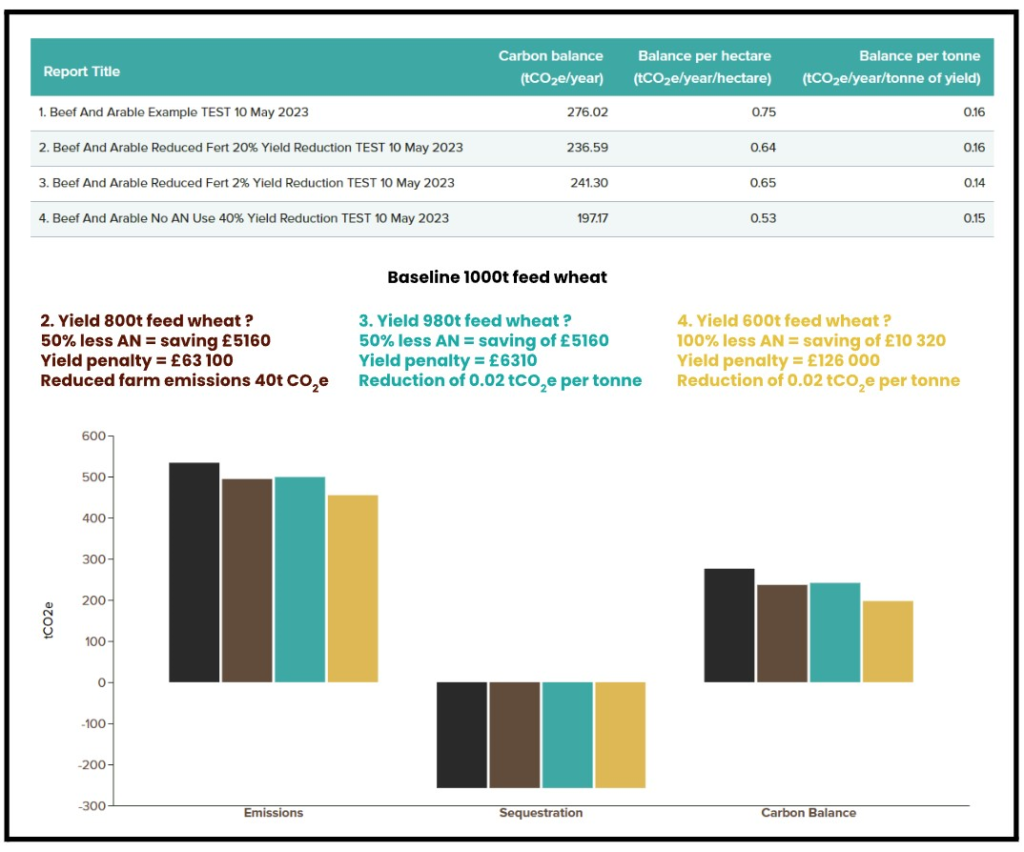
Even small reductions in fertiliser use can have a big effect on a farm’s overall carbon footprint. The following chart shows a comparison of the same farm with three different scenarios. They are for illustration only as the impact on yield of reducing or changing the fertiliser usage can vary hugely from farm to farm. The baseline in scenario 1 (black) uses 30t of EU AN fertiliser and 30t of Mole Valley powerblend 26-14-14 to produce 1000t wheat on 100ha, 350t OSR on 100ha and 350t field beans on 100ha. They also spread 100% of the manure and slurry from their 40 head of beef cattle on the arable land.

In scenario 2 (brown) the quantity of AN fertiliser has been reduced by half to 15t but all other N sources have been kept the same. This reduces the carbon balance by approximately 40t CO2e. For some farms this might have a large impact on yield while for others the impact may be minimal depending on the soil quality, crop/ variety being grown, timing of applications and which crops are prioritised in terms of N demand. 

Even if this reduction in AN use resulted in  a 20% reduction in wheat yield, the per tonne footprint of the crops remains the same between the baseline fertiliser use and scenario 2. It is also worth considering the financial saving of reducing AN fertiliser by 15t (at the time of writing this would be a saving of approximately £5160 at £344 per tonne). 

Assuming the reduced fertiliser application is on the highest value crop (wheat in this example), and taking the price of Yorkshire feed wheat (£315.5 per tonne) to estimate the financial hit of an extreme 20% reduction in wheat yield between scenario 1 and 2, this would equate to a cost of £63 100. In contrast, in scenario 3, we have shown the same inputs but with only a 2% yield reduction for wheat compared to the baseline, for which the yield penalty would equate to £6310, assuming the fertiliser saving can be made by reducing application on the less valuable crops/ pasture. At the current price, the saving on fertiliser does not outweigh the cost of the yield reduction but with both markets fluctuating so much, there will be times when it is advantageous.
In scenario 4, we’ve gone so far as to remove any AN fertiliser (though of course in this example farm there is still 30t Mole Valley 26-14-14 and the beef herds’ manure and slurry being applied). This reduces the total emissions of the farm by 79t CO2e. We have modelled a 40% reduction in wheat yield here which would obviously equate to a huge cost of £126 200 (using the same assumptions as above) if the wheat were being sold. However this yield reduction may still  be acceptable where the wheat is being fed to the beef herd and the farm exceeds it’s requirements. Alternatively, in this case, the farm might consider switching to a different rotation to be able to feed the cattle the required ration without the need for the high cost of AN fertiliser (scenario 4 represents a saving on fertiliser of £10 320 compared to the baseline scenario 1).

This is an example report, and of course, the real-world decisions on how to reduce fertiliser use are much more complex. AHDB have some research and guidance on what may or may not be feasible here and a tool for calculating fertiliser adjustments here. Alternatively you can get in contact with our team of advisors who have lots of experience weighing up the pros and cons of fertiliser reduction in each unique setting.

Getting in touch

If you have any questions/comments please email calculator@farmcarbontoolkit.org.uk

Find out more

You can find all our useful calculator resources here.

This blog was written by Lizzy Parker, our Calculator Manager.

Using the Calculator: focus on sheep

This month we’re focusing on calculating emissions and sequestration from your sheep enterprise.

To accurately estimate the emissions and sequestration from your sheep enterprise, you will need to add data to the following sections of the Calculator:

  • When setting up the report, make sure you enter the area of grazing (grassland) as well as any non-agricultural land area and cultivated land (arable or horticultural)
  • Use the Livestock section and select sheep. Add as many entries as you need to cover your flock. So for example, you may have two breeds with different liveweights, in which case enter the ewes from the first breed with one liveweight and then the ewes from the second breed as a separate entry with their own liveweight. This will give you more accurate emissions from their enteric fermentation (gut methane).

  • To calculate the average head of livestock on farm over a 12 month period, take the number in a particular livestock category per month (so you have 12 “snapshots”) add these  together and then divide by 12. Our data collection sheet has a helpsheet for this. For lambs you may want to use the same approach for calculating average liveweight (our defaults assume a midpoint liveweight through the year for growing lambs but growth rates won’t be linear so using the snapshot approach may be more accurate).
  • “Livestock” entries capture the CO2 equivalent of the methane emissions from enteric fermentation and of the nitrous oxide (N2O) emissions from the animals’ manure over the course of the year. The Calculator asks you how this manure is managed as this has an impact on the N2O emissions.
  • You will need to account for any supplemental feeding via the Livestock > Animal feeds option – this is for brought-in feeds that were produced off-farm.
  • If you use any additional fertility sources, you will need to account for these where they have been brought-in. For manures, slurries, AD digestate, water treatment cake, lime or mineral fertilisers, use the Crops tab. For chemical fertilisers, use the Inputs tab.
  • Account for all your fuel use, electricity use, consumables, inventory items and waste produced using the relevant sections (Fuels, Materials,  Inventory, Waste).
  • We recommend getting your soil sampled and have a guide on how to do this effectively and affordably. By monitoring your soil organic matter or soil organic carbon over time you can begin to log sequestration rates in your grazed (or other) soils. Once you have two years’ worth of soil sample results, you can enter these in the Calculator under Sequestration > Soil Organic Matter (you will also need bulk density measurements and a record of the depth of the sample).
  • If you don’t have directly sampled soil data for all your soils, you can use our range of proxy values for different Countryside Stewardship and habitat classes to estimate how much carbon your soils may be sequestering year-on-year. You can also measure the length of any hedgerows and field margins (ungrazed) and enter these to estimate the carbon sequestered in them on a yearly basis.

Getting in touch

If you have any questions/comments please email calculator@farmcarbontoolkit.org.uk

Find out more

You can find all our useful calculator resources here.

This blog was written by Lizzy Parker, our Calculator Manager.

Farm Carbon Calculator update May 2023

Farm Carbon Calculator logo

This month we have launched further improvements to our Farm Carbon Calculator that enables farmers and growers to measure and understand the carbon footprint of their business.

In this upgrade there are a large number of improvements to the data and calculations that underpin the tool. This means we are up-to-date with the latest science and correspondingly your carbon reports are more accurate. We constantly aim to be reflecting the most recent emissions factors. In this upgrade we have updated factors and calculations in:

  • Livestock (including new category descriptions)
  • Fuels
  • Distribution
  • Materials
  • Processing

In addition, we’ve re-ordered and updated the list of sprays, as well as a new sub-section for molluscicides. Some additional mineral amendments and specific fertilisers have been added too.

Animal feeds are a very important issue, and the impact of feeds on the footprint of livestock farms can be very significant. We’re constantly trying to improve the information available in this area and have expanded the number of items on offer. This is a continual topic of research for us.

There are some changes to how users select a report date, so that a start and end date is required (for the 12 months of the report). This is due to how our database works, which is a hidden but important area of the improvements we’ve made.

Renewable energy exports now don’t show up as a carbon offset, in line with scoping guidance provided by GHG Protocol, which is a globally recognised carbon standards organisation.

Details of all the changes can be found here, including a list of sources of our emissions factors.

Next stages

Months of research, development and testing by the Calculator team have led to this point. We are proud of what we’ve achieved, and see it as a vital improvement for users. But, more excitingly, the development continues as part of the two projects that are going to radically improve the user experience of the Calculator. This first stage of these feature upgrades will be launched in early September.

The Tesco-WWF funded work, in partnership with Produce World, focuses on improving the user experience, building infrastructure to allow carbon data to flow through the supply chain, with improved benchmarking and target setting for users, and an international version.

A parallel Innovate UK funded project, in partnership with Velcourt, CHAP and Agrimetrics, will strengthen many of the above developments, as well as enabling better data flow into and out of the Calculator. This stage of the feature upgrades will be completed at the end of December.

These are hugely exciting developments for the Farm Carbon Calculator, so expect to see much more activity from us in coming months and, importantly, a much improved tool for our users. Alongside our project partners, we are supporting the food and farming sector to cut carbon emissions and reach beyond net zero.

Resources

There are a range of resources for users of the Calculator on this page https://calculator.farmcarbontoolkit.org.uk/resources, including the popular Data Collection Spreadsheet which gives guidance on how to complete data collection and the process of completing the report.

There are also useful FAQs and a ‘how to’ video on the Calculator homepage. You can also login to access your reports here, or set up a new account if you’re new to the Calculator https://calculator.farmcarbontoolkit.org.uk/

Accounting for carbon in upland systems

In order to understand how to manage carbon on your farm it is important to first be able to measure it. Knowing where your emissions and sequestration are currently coming from, and what that means in terms of hotspots, should be the basis of developing strategies for the future, but what if it’s difficult to work out how to measure it?

This is exactly the conversations that the team at FCT have been having recently with upland farmers. Through our project work with the Yorkshire Dales National Park, farmers across Dartmoor and the Fellfoot forward partnership, farmers have often felt that the current available carbon tools don’t reflect their farms; an issue which is compounded when they are also grazing commons.

How to ensure that grazing allocations for common land are accounted for, so that the impact of management can be included across these special areas is complicated. This is compounded where there are multiple graziers who may have different numbers of stock and areas of the common, and may also be managing in different ways. These areas are immensely important for carbon sequestration, and, where the environment is peat dominated, management may also contribute to large quantities of GHG emissions as the peat is degraded.  Often management of these areas is tightly managed by stewardship schemes to protect biodiversity and natural capital which can sometimes mean that grazing numbers are tightly controlled.

So, what is actually happening on the commons and how do we account for the carbon footprint of the in-bye land and the commons so that the farmers in these landscapes can provide an accurate assessment of what is happening?

We are incredibly excited to be working on a new project with the Foundation for Common Land on their Upland Commons project to dig a little deeper into these issues. We will provide a version of the Farm Carbon Calculator that is specifically designed for GHG accounting across these landscapes, pioneering an approach that empowers the commoners to understand the current carbon balance and what can be done.  The project will work in partnership with the commoners of Kinniside Common in the north west of the Lake District to test the new calculator and provide feedback to ensure that what has been developed meets their needs.

Where are we now?

Currently the calculator team are working to collect all the available research and insights to ensure that the best data sits behind this new calculator. At the same time our advisory team are busy talking to commoners, land holders, environmental organisations, Natural England and others to understand some of the complexities and multiple objectives to provide a tool which has genuine use on the ground and will provide insight into the carbon balance of these diverse ecosystems and how they are farmed. 

Thank you to the funders

Thanks to National Lottery players through the National Lottery Heritage Fund, Esmée Fairbairn and other local partners and funders of the Foundation of Common Land.

Press release: Carbon Calculator Update

Release date: 5th May 2022

Farm Carbon Calculator upgrade gives users an even better experience, underpinned by the latest science.

The Farm Carbon Calculator has released another major upgrade to its free online tool, which is designed to help farmers and growers understand and manage greenhouse gas emissions in agriculture and horticulture.

This latest upgrade – the second in six months, focuses on usability, livestock, nitrous oxide, crops and fertilisers. Calculator users will notice significant improvements in design and usability, in particular:

  • Clearer design and layout across the user interface
  • Results reorganised to give users a clearer understanding of their emissions and sequestration results
  • Benchmarking allows users to understand where their carbon footprint is in comparison to other users
  • Results split into all greenhouse gases, and Scopes 1,2 and 3 for clarity
  • A new way of recording yields of crops and outputs of livestock

The well regarded Nitrogen Module, introduced in November (and kindly funded by WWF-UK), has also received a significant design improvement in this latest upgrade.

Designed by farmers for farmers, the Farm Carbon Calculator offers an intuitive user interface and a comprehensive and accurate list of categories for all farmers and growers across the UK.

Regarded by many as the most comprehensive, accurate and user-friendly carbon calculator available to farmers and growers, the Farm Carbon Calculator is one of just three tools recommended by the NFU to its members.

Currently thousands of users already benefit from the free tool to calculate the carbon footprint of their business, identify ways to reduce their emissions – and increase farm profitability.

Jonathan Smith, Carbon Calculator Director, says

“The drive for continual improvement in the Farm Carbon Calculator is always at the forefront of our minds. Understanding what our users need, whilst keeping on top of rapidly emerging science is a constant challenge, but one that excites and motivates us.

“Never before has carbon management been so important for farmers and growers in the UK. Yet the scale and pace is only likely to accelerate over coming months and years. We understand the importance of our users being empowered to measure, manage and mitigate carbon in their businesses in a user-friendly and cost-effective way.”

Oliver Kynaston, Carbon Calculator Manager, says

“This upgrade, hot on the heels of last November’s release, features important upgrades to methodologies and emissions factors in key areas for many farmers: livestock, fertilisers and crop residues. Our drive for accuracy is always high on the development list.

“We are particularly pleased with the re-design of the interface, which presents data entry and results in a very clear way to users. It’s vital that these tools are as easy to use as possible for today’s busy farmers and growers.”

This upgrade was completed in association with our valued web development team at Creative Coop, with whom Farm Carbon Calculator has worked with for over 10 years. Their expertise in design and software development is a very valuable part of the Calculator.

The Farm Carbon Calculator is free for farmers and growers to use. Visit https://calculator.farmcarbontoolkit.org.uk.

A Commercial Licence is available for consultants and advisors wishing to use it for profitable purposes, with integrated training and support.

White label versions of the Farm Carbon Calculator can also be designed and developed for individual businesses, organisations, and groups. For more information on either product contact calculator@farmcarbontoolkit.org.uk

Notes for editors

  1. Farm Carbon Calculator is owned and managed by Farm Carbon Toolkit (FCT). FCT was set up in 2010 to provide advice, support and encouragement to farmers and growers wanting to reduce their carbon footprint. It is actively engaged in research, training, and consultancy work. It is run by farmers for farmers and is a Community Interest Company.
  2. Farm Carbon Calculator has been running for over 12 years. It is free for users and always will be.
  3. For press interviews please contact Jonathan Smith jonathan.smith@farmcarbontoolkit.org.uk or 07528 136678.

The Farm Carbon Calculator just got even better

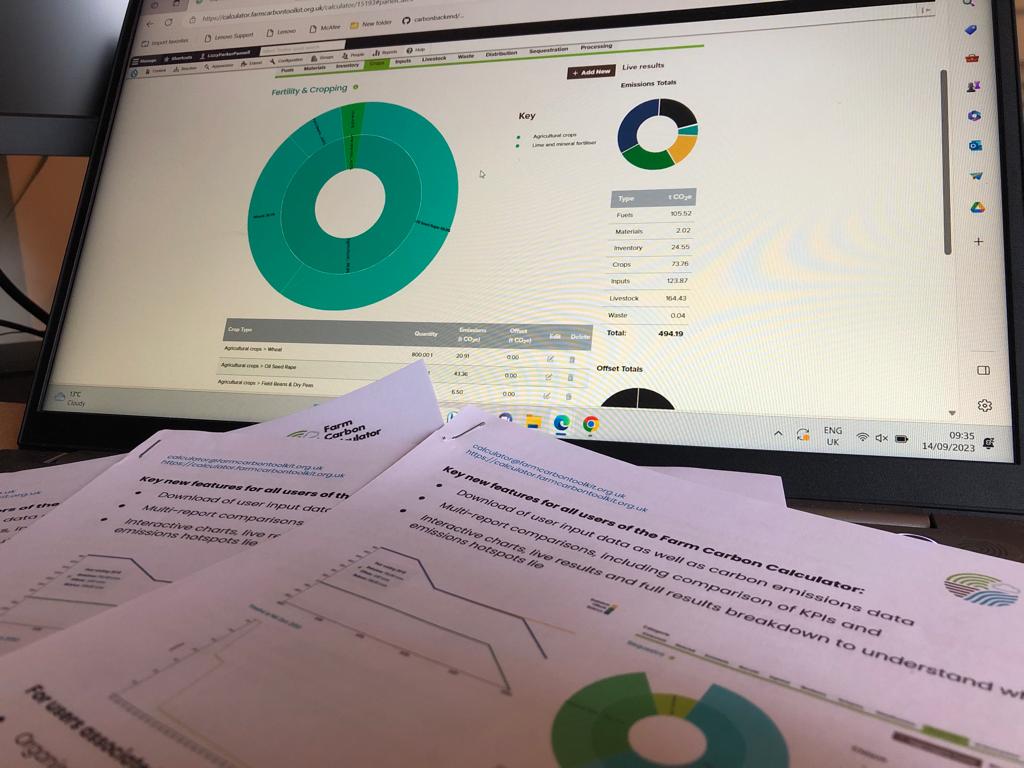
Calculator results

As part of our commitment to being the best carbon calculator for farmers and growers in the UK, we have just launched another upgrade. This comes hot on the heels of another major upgrade in November, and shows our commitment to the many thousands of users that value the Farm Carbon Calculator.

To ensure we are reflecting the latest science, this upgrade features major improvements to emissions factors and methodologies for the livestock, crops and fertiliser sections. Using the latest IPCC and UK Greenhouse Gas Inventory data, we always aim to provide users with the most up to date emissions and sequestration factors.

For users though the biggest changes will appear in the interface, which has received a major design overhaul. Focussing on how users can better understand results, what they need in terms of outputs, and how the data input process flows, we believe we’ve got the best version of the Farm Carbon Calculator yet.

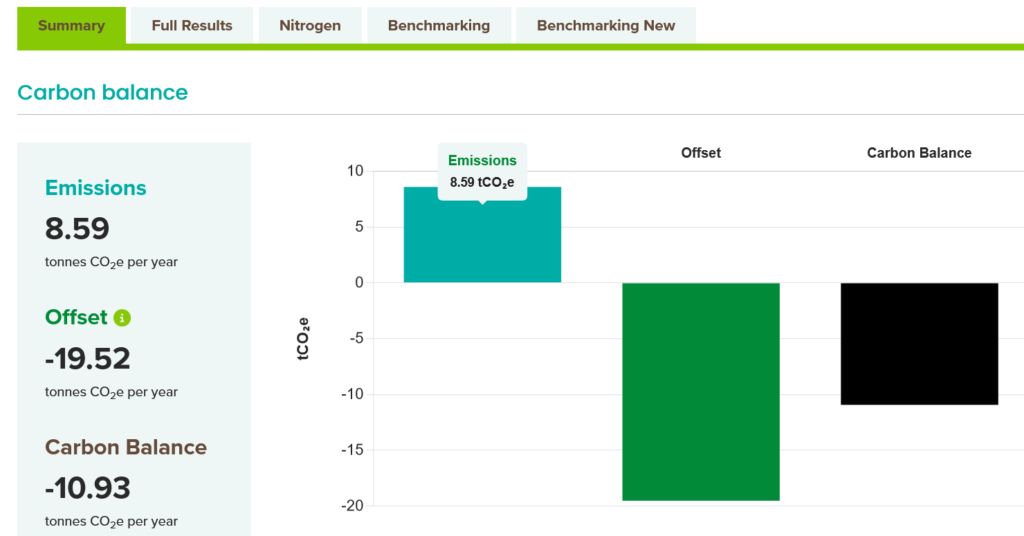
Carbon balance is clear and easy to understand

A new feature is benchmarking, so farmers and growers can see where they are compared with other users, total emissions or carbon balance per tonne of product and per hectare. This applies to overall business emissions, and if working on a product basis, then against other similar products (e.g. wheat) also.

Understanding your carbon footprint (orange) against other users

Data entry has been improved to give a clearer layout, and useful information to help users understand what information is required and what it will be used to calculate.

Data entry, showing improved charts with understanding of proportions and amounts of carbon for each item

Useful information is in the ‘i’ buttons when you hover-over them

Emissions are now also shown in detail, by Scope (1,2 and 3), and Greenhouse Gas type (carbon dioxide, methane and nitrous oxide) for each section.

Detailed emissions breakdown table

The Farm Details page is much more clearly laid out, also with helpful tips.

Farm details section

There is clearer navigation in the Reports section too, where you can Edit data, Download your report as a PDF or CSV, compare against other reports you’ve done, or Share your report with others. At any time you can go back to your reports.

The Nitrogen Module is clearer now and gives you a better understanding of the Nitrogen flows through your farm.

Nitrogen Balance

We hope you find the tool even more useful than before. There are lots of FAQs on the Calculator home page, and if you get stuck you can always contact us for more help.