
Written by Jonathan Smith, Impact Manager, Farm Carbon Toolkit
For the last 10 years, Farm Carbon Toolkit has hosted the Soil Farmer of the Year (SFOTY) competition, seeking out the farmers and growers across the UK who are doing the best job at improving their soils and underpinning their businesses with healthy soil management. The 2025 competition is open now and you can enter here, as well as see details of our past winners. The competition runs in partnership with Innovation for Agriculture and is supported by Hutchinsons and Cotswold Seeds.
Over the years we’ve had many inspiring finalists, so we thought we’d share information on some of the winners, what they’re doing on soil management, and some top tips.
Growing soil biology
In 2018, SFOTY winner Simon Cowell, an arable farmer from Essex delves deep into soil biology to create the conditions for his crops to thrive. He makes his own compost and applies it at 2-4 tonnes/acre, more as an inoculant than as a fertiliser, as Simon explains:
It’s not being used as a fertiliser source or for organic matter, it’s purely an inoculation for the soil biology and a home to grow biology that will benefit the soil. Within a few weeks you can see the difference where it has been applied
Through a mixture of crop rotation, on-farm trials and compost, the use of applied Nitrogen has decreased dramatically and the use of agrochemicals. Noticing that the plants nearer the hedge look healthier, Simon comments:
My aim is to get the biology and fungal network to transfer all those benefits throughout the fields, although it’s going to be a slow process.
Farmers should be beekeepers
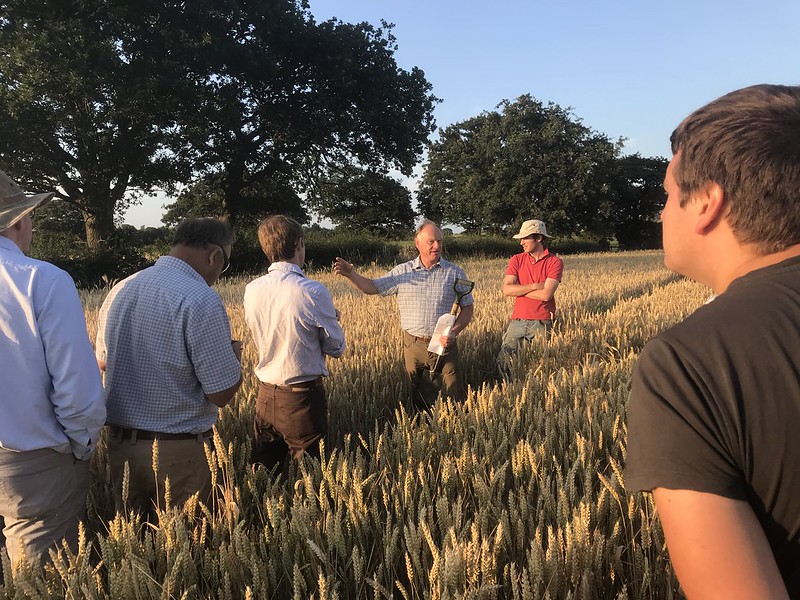
Over in Oxfordshire, another arable farmer was the 2019 winner. Julian Gold grows a range of crops on 800 ha, with a small flock of sheep to manage the green manures. He’s over 10 years into his journey of minimising tillage and covering the soil as much as possible. He’s tuned in to his soils and how they’re working now:
If you know your soil and are on the right trajectory, you don’t need to do soil testing. I can see the straw disappearing and see worm middens, I know it’s healthy and doing what it should be, but it can take time.

Trials with Universities and Research Institutes has been common on the farm over many years, and has looked at greenhouse gas emissions, soil health and biodiversity on the farm. Julian advocates that all farmers should be beekeepers:
…….as with all things its about a change of mindset. This is true of fertiliser use, crop protection and carbon farming
Using electric fences instead of fertiliser
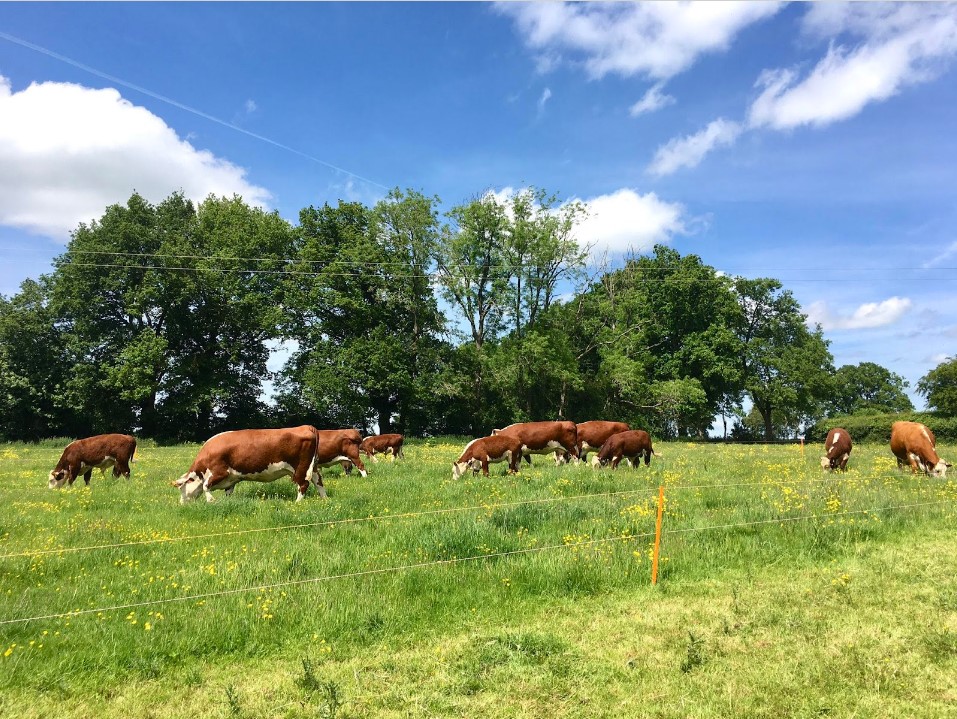
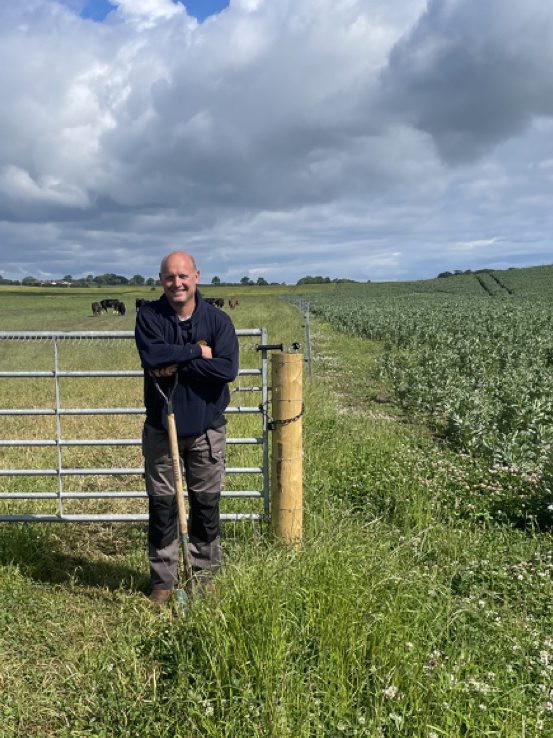
In 2022, Herefordshire farmer Billy Lewis demonstrated how his mixed farm had turned around and really improved its soil massively. A combination of direct drilling, applying compost, mob grazing, reduced inputs and introducing legumes has transformed the soil health, productivity and profitability.
On the new grazing system, Billy comments:
Since beginning our rotational grazing system we no longer apply fertiliser to our permanent pasture. You will grow ten times more grass with an electric fence than you will with a bag of fertiliser.
Fertiliser use has reduced by 50% over 3 years, with an aim to eliminate it in the future
Noting that arable crops have become much more profitable now, and the livestock more relaxed and healthy, Billy believes this is down to both a reduction in inputs and an improvement in soil biology.
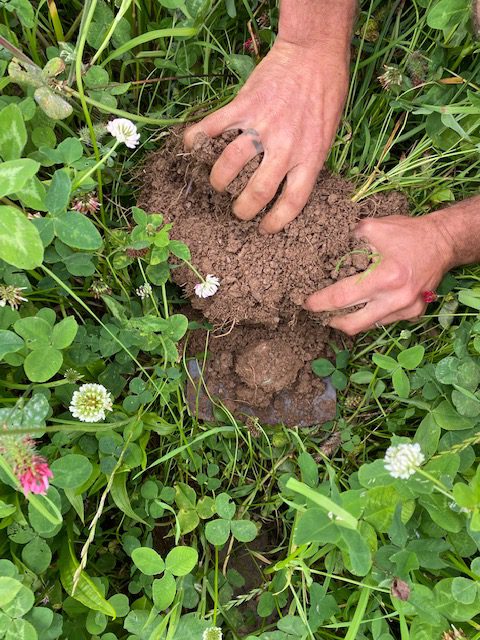
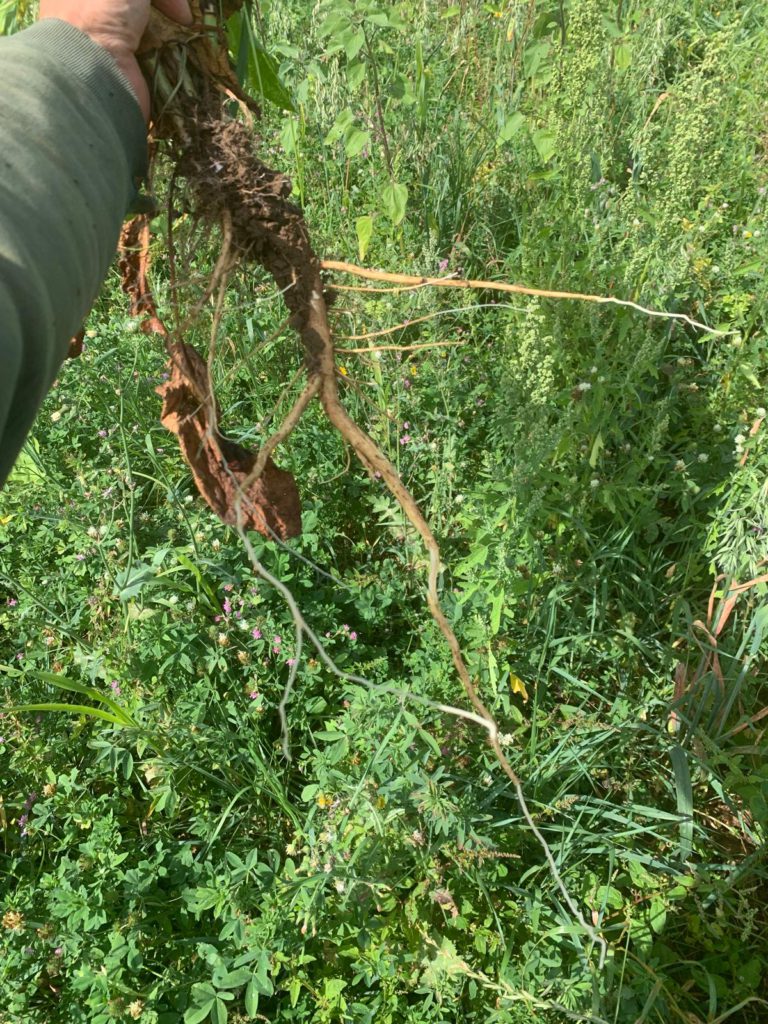
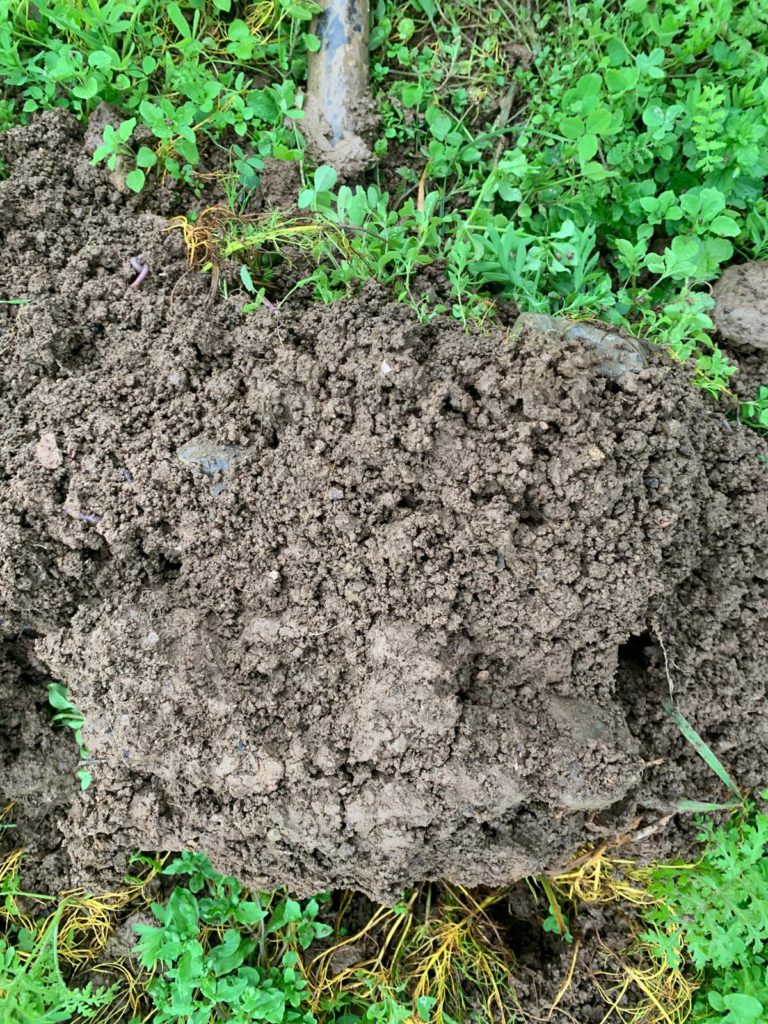
When we dig up any legume species, be it in a herbal ley, cover crop or in the clover living mulch, we’re seeing plenty of nodules forming and more importantly we are noticing that they are active due to the dark purple colour when they are sliced open.

12 million worms per hectare
Arable farming can face greater challenges in rebuilding soil health and carbon. 2021 winner Tom Sewell is farming over 1500 acres in Kent with his wife Sarah. The farm is both at a serious scale but also working across a range of soil types. Minimum cultivation and direct drilling have been used for some time on this farm and Tom was an early adopter.

Through a combination of providing minimum disturbance, and adding organic matter – through straw, cover crops and compost, the organic matter has gone up worm counts are very healthy. Tom reckons there are 12 million worms per hectare!
A ‘simple system’ that maximises soil health has allowed them to reduce fertiliser use by 10% per year, yet maintain yields and improve soil health continuously. Tom says:
I just want to improve the soil, I use compost and feed the worms, they’ll do the rest.
Using all the tools
Over at Overbury Farms in Gloucestershire, 2020 winner Jake Freestone farms over 1500 hectares with a diverse arable rotation, plus 1,000 sheep across a wide range of soil types. Jake is using fungal-rich seed dressings to improve germination, soil biology and reduce costs.
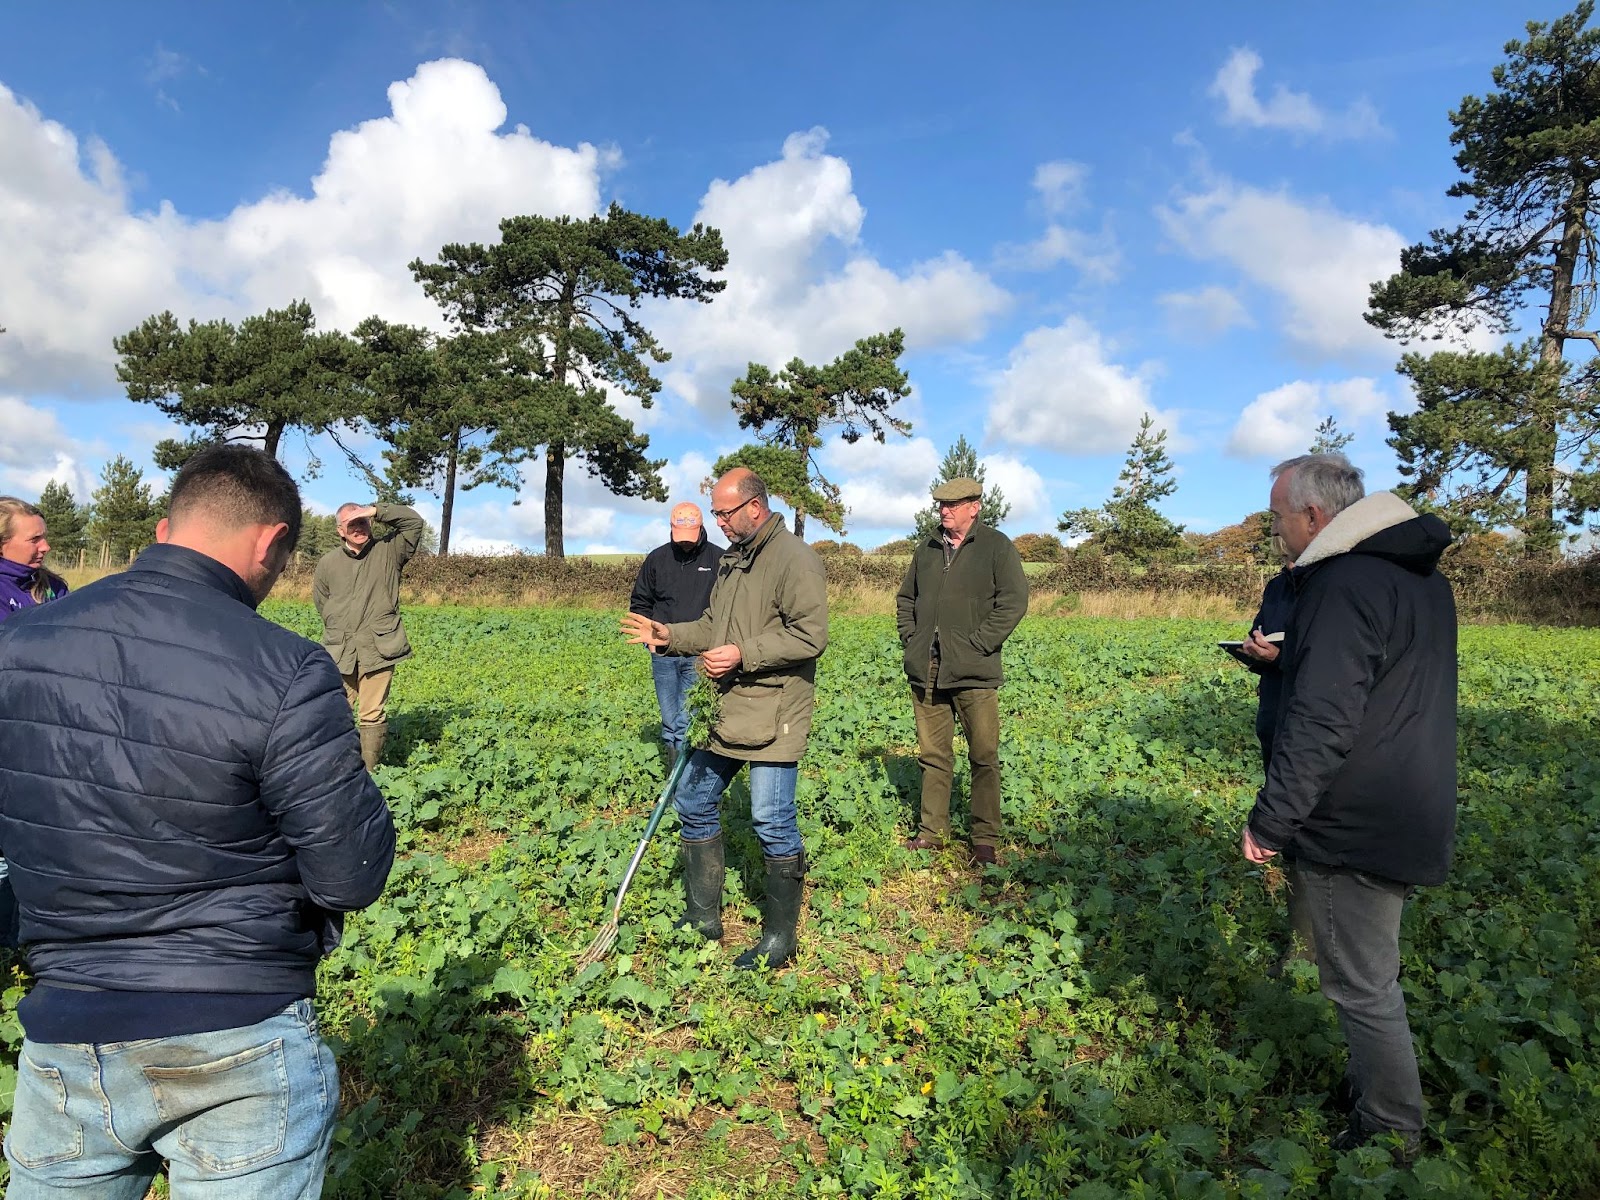
Nitrogen fertiliser is being reduced, other inputs reduced, cover crops experimented with extensively and sheep being a key part of the rotation. “
Jake comments:
Ultimately we are trying to use all the tools that we have to improve soil organic matter, water infiltration and wider water management, soil structure and soil biology to achieve the long term goal of improving our resilience both for our crops, our business and our soil.
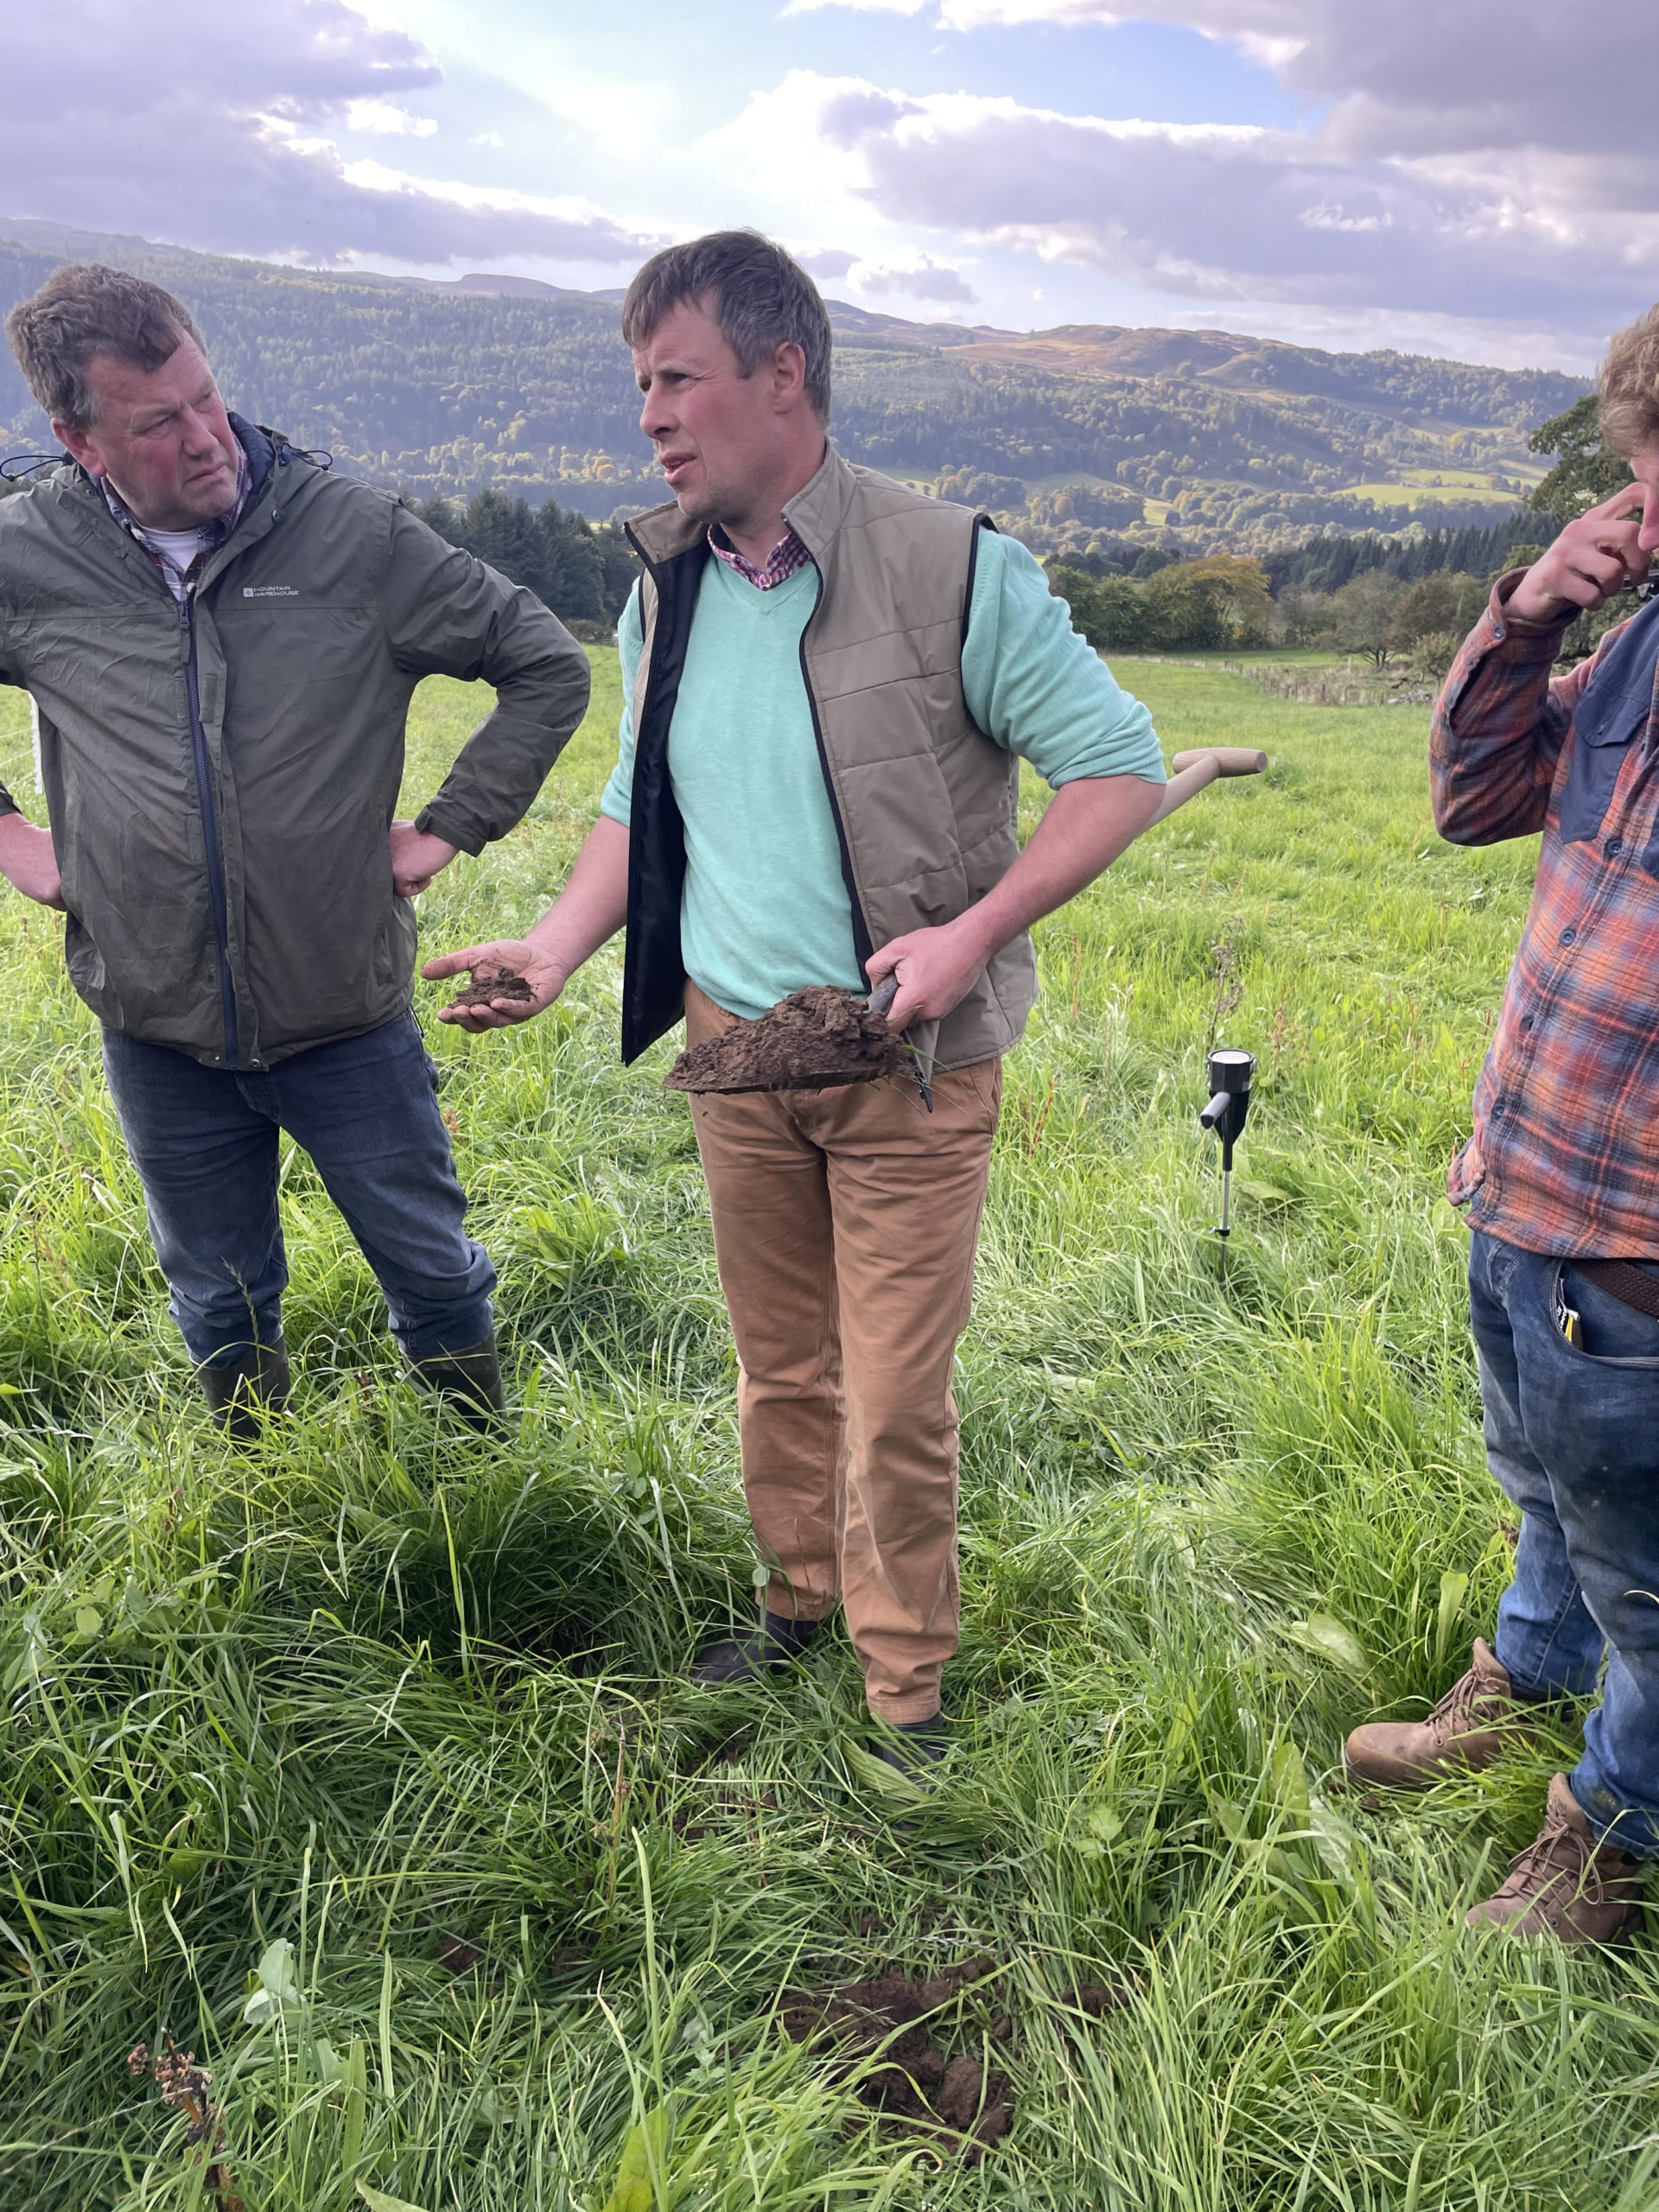
A 10-year transformation
Back to mixed farms and in 2023 winner Stuart Johnson in Northumberland demonstrated how 10 years of work has transformed his farm, primarily by reducing inputs, improving soil health and livestock productivity. Moving to a strip-tillage system and mob grazing platform has provided financial success alongside a more resilient business.
Stuart has now eliminated fertiliser on his grassland and fungicides in the arable crops, instead utilising an integrated system with the livestock and compost teas to grow what is needed on the farm. The farm is currently in a seven-year rotation of a five-year legume/herb mix followed by a two-year arable break with full grass grazing for the sheep and cattle meaning that there is no need to buy in additional supplementary feed over the summer months.
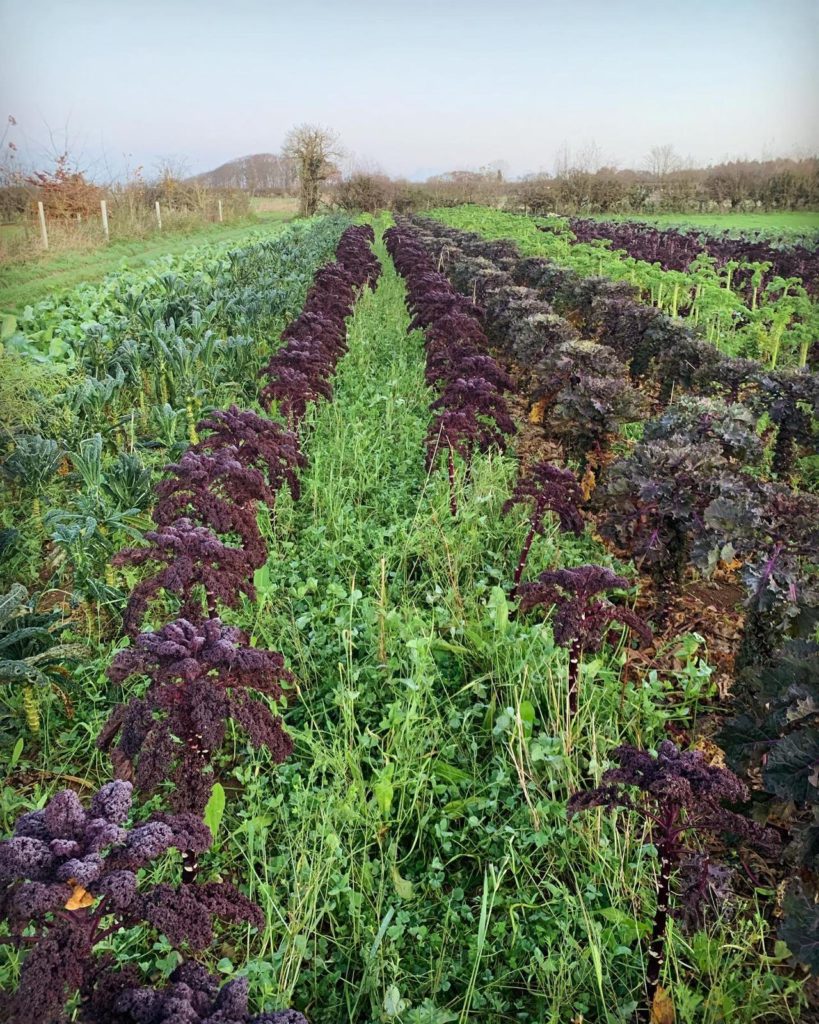
Herbal leys and vegetables
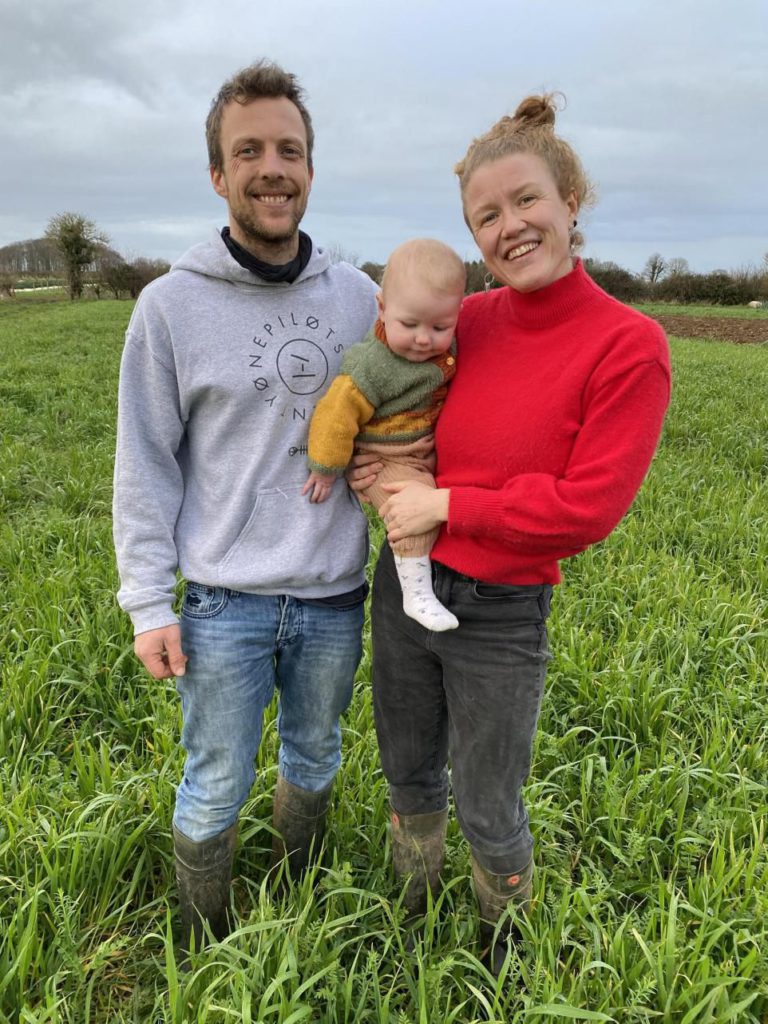
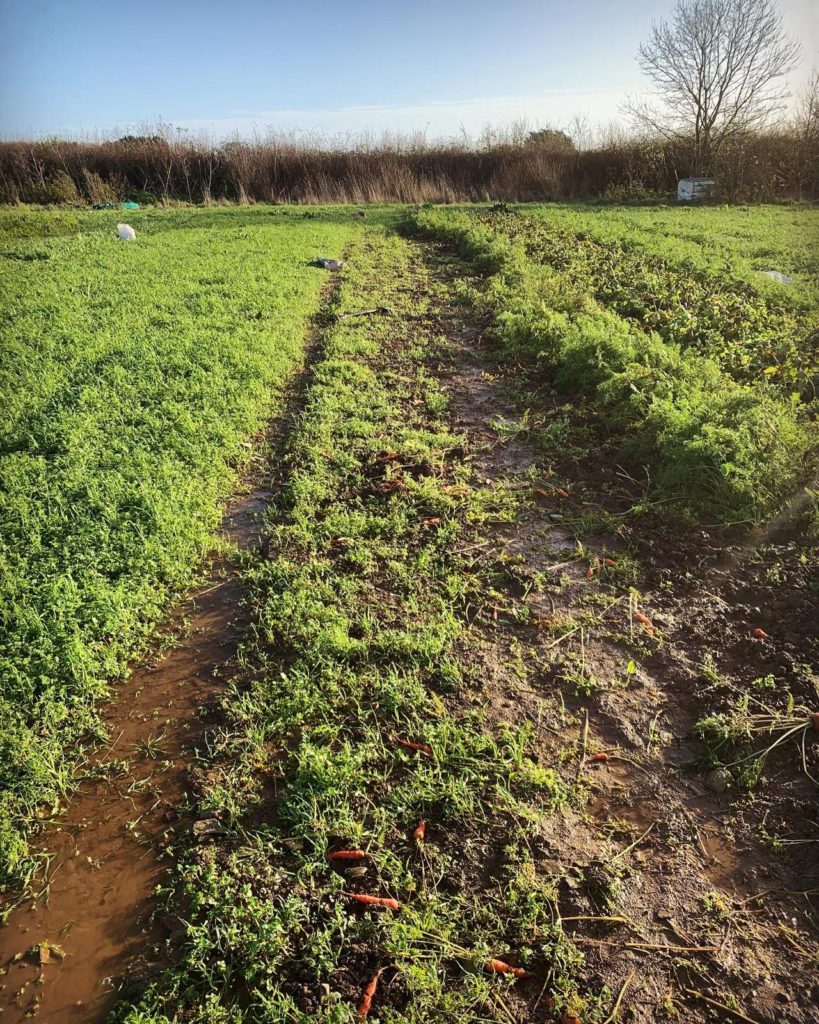
Bringing us right up to date, 2024 winners Tracey Russell and David Neman at Bucksum Farm in Buckinghamshire show in this video how herbal leys and vegetables sold directly is working successfully.

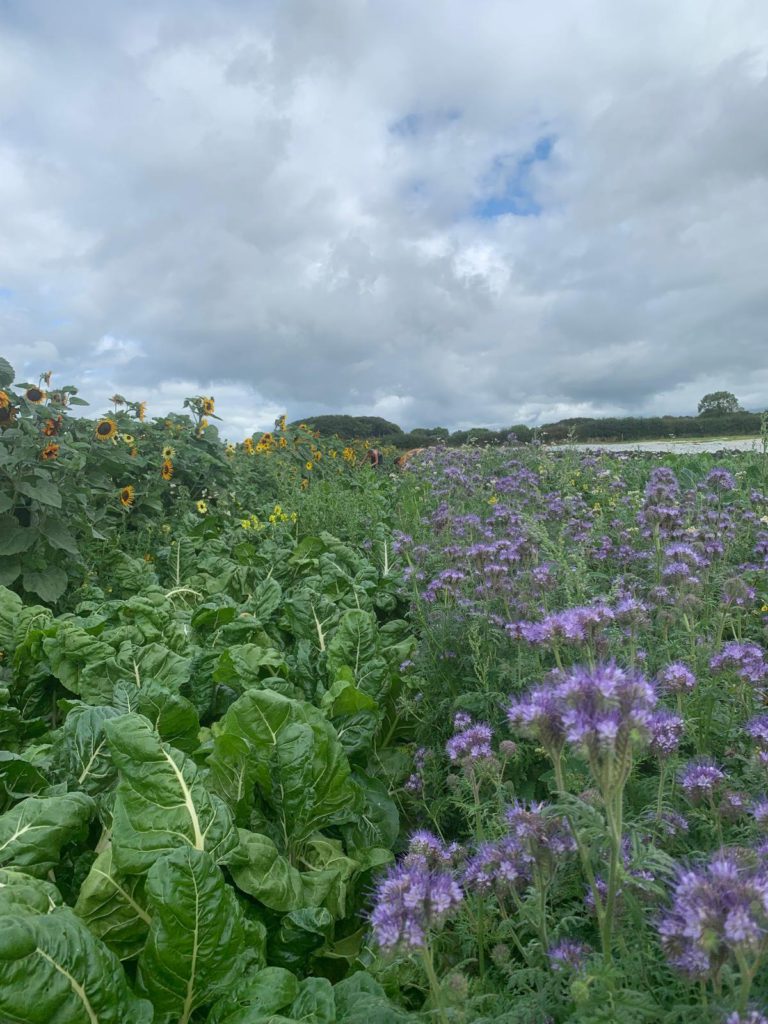
Creating their own compost, using extensive herbal leys (grazed by sheep), they also incorporate living mulches amongst the vegetable row crops. Incorporating top fruit and chickens too, the farm is an exemplar of how to grow fruit and veg in a sustainable rotation whilst improving soil health.
Learn even more!
We also have amazing 2nd and 3rd place Soil Farmers from each year, and you can read more about them here.
Don’t forget, if you think your farming practices are worthy of being entered in the competition, please do consider entering the 2025 Soil Farmer of the Year competition. It’s free – what have you got to lose?


Recent Comments