

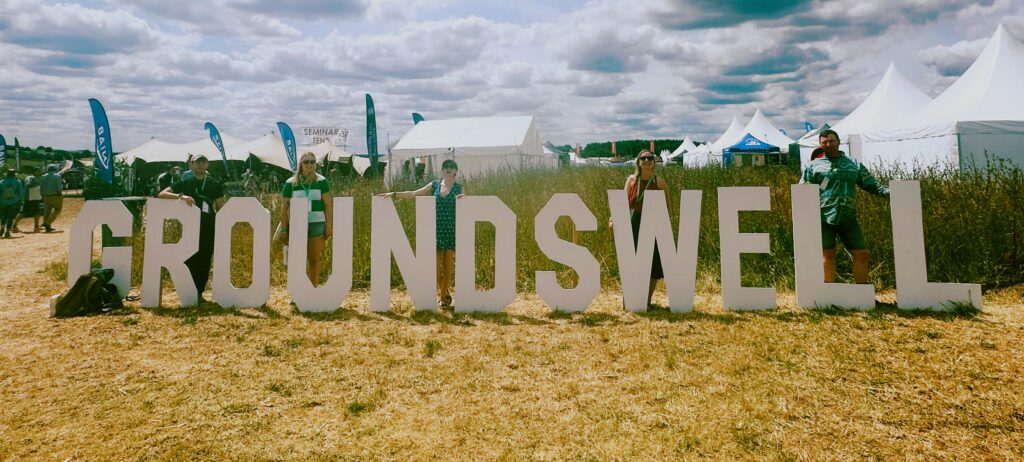
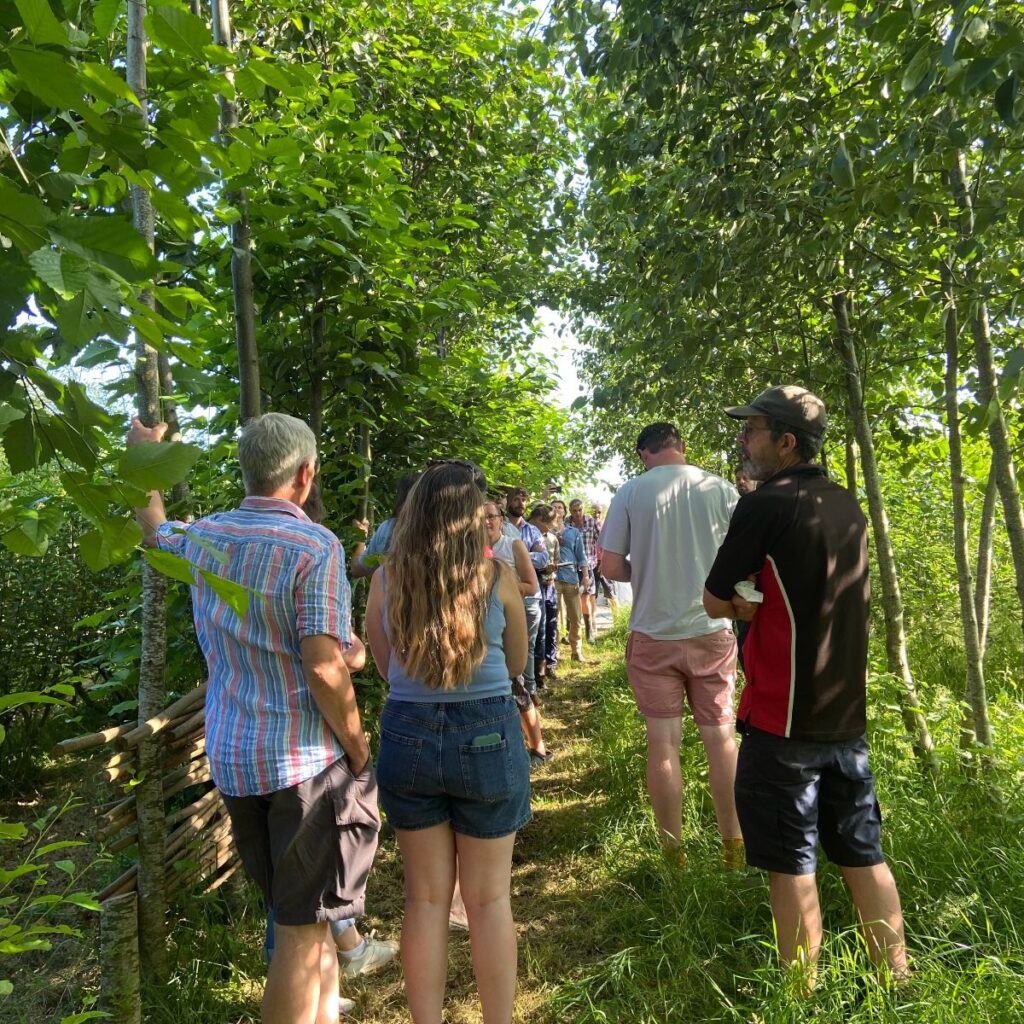
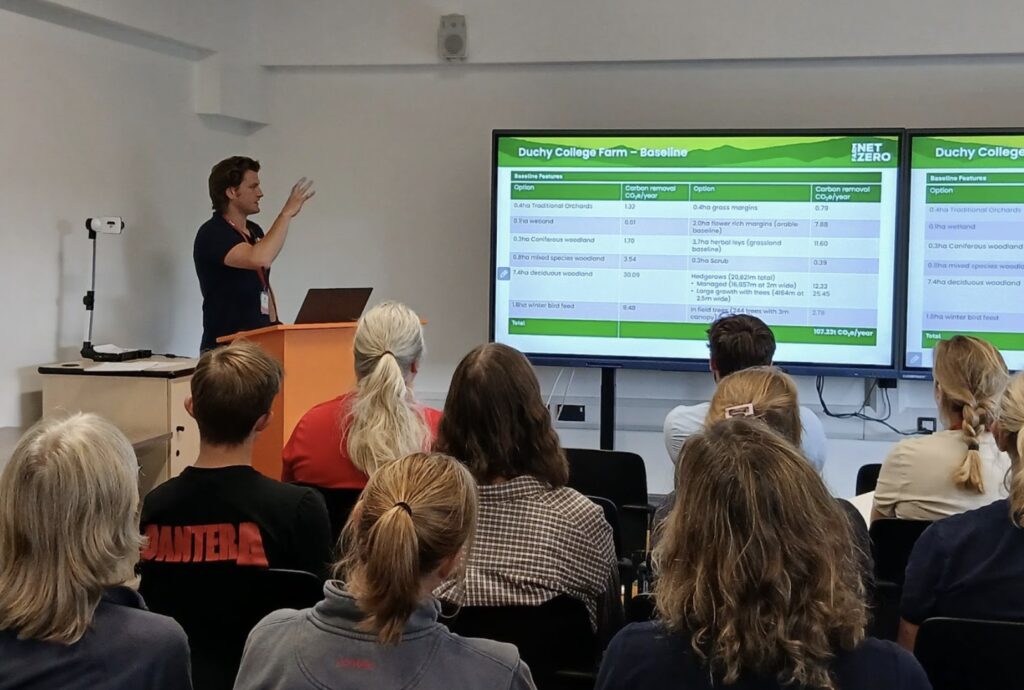
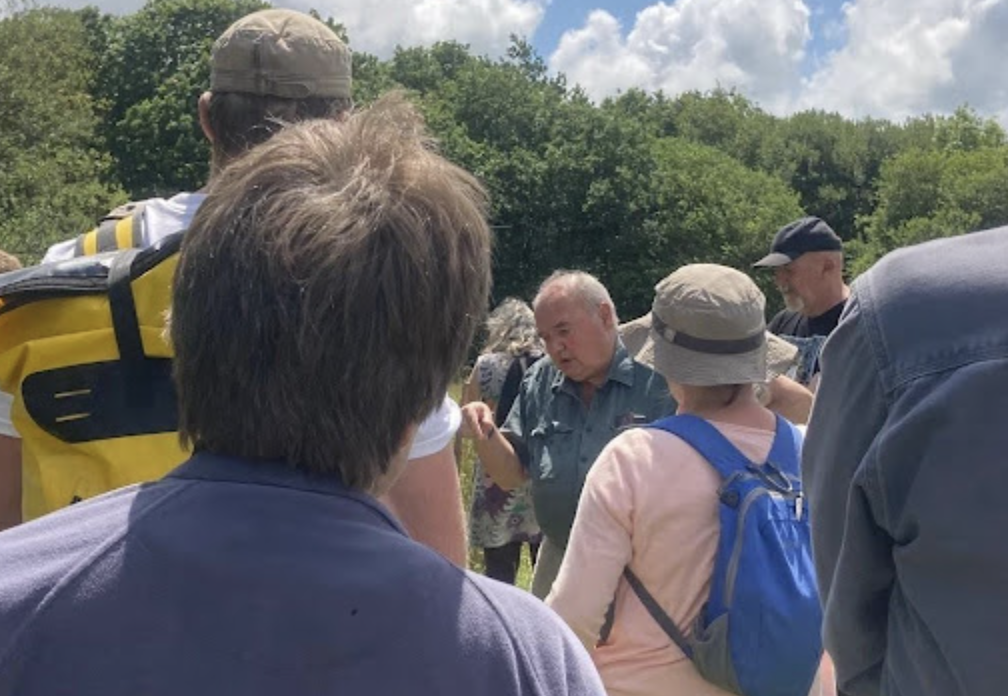
For people unable to make our Annual Field Day held in North Lincolnshire at the end of September, we have captured some of the take-home messages from the morning farm walk around the Pink Pig Farm, with our hosts, the Jackson family.

During the morning, we walked around the farm, pausing at four stations to hear from our farmers and FCT staff. Our four stations covered:
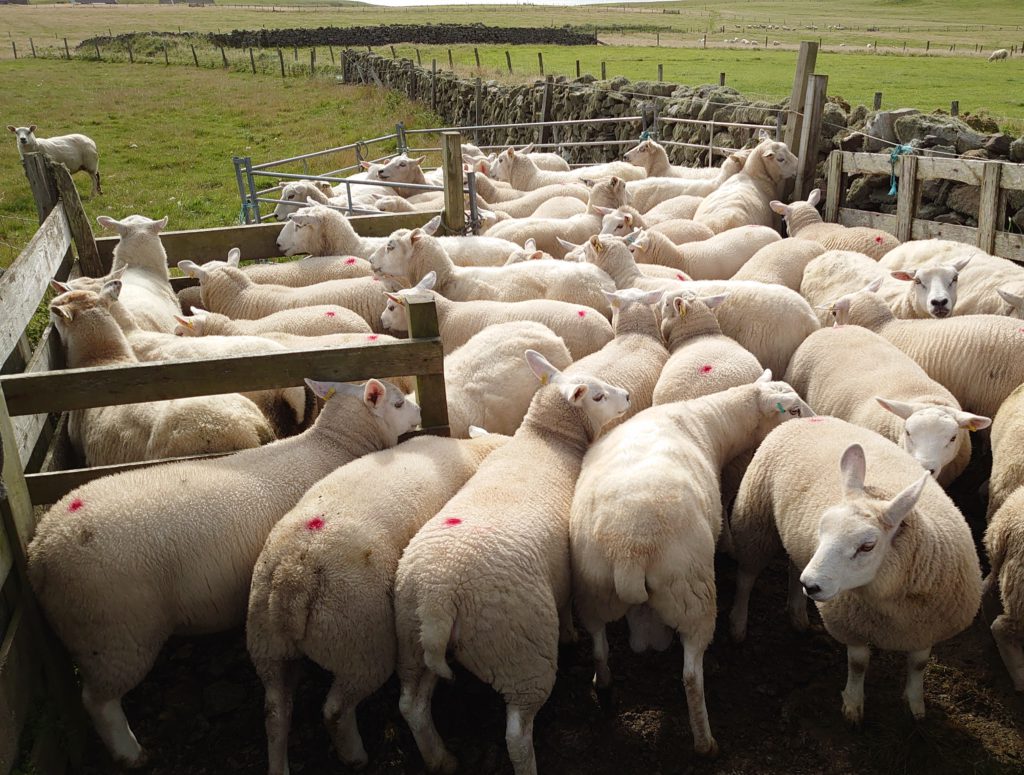
Plant Nutrition: Diagnostics and Low-Input Management
Integration of livestock into arable rotations
The importance of soil health
Regenerative farming ten years on

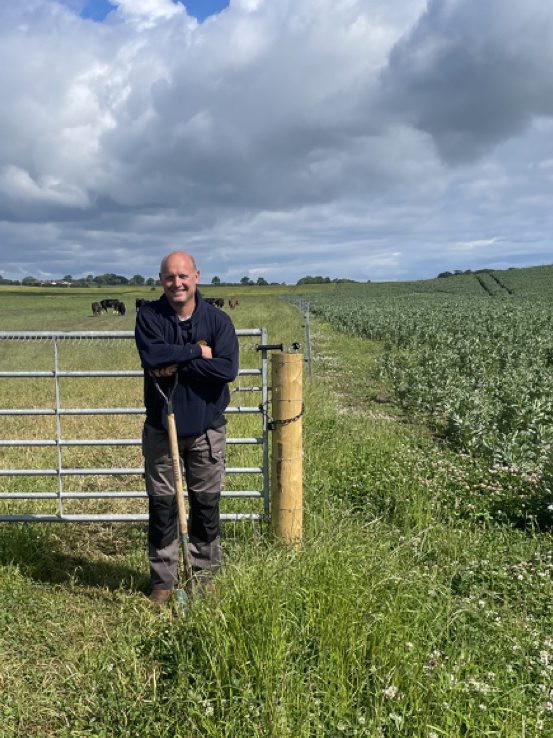
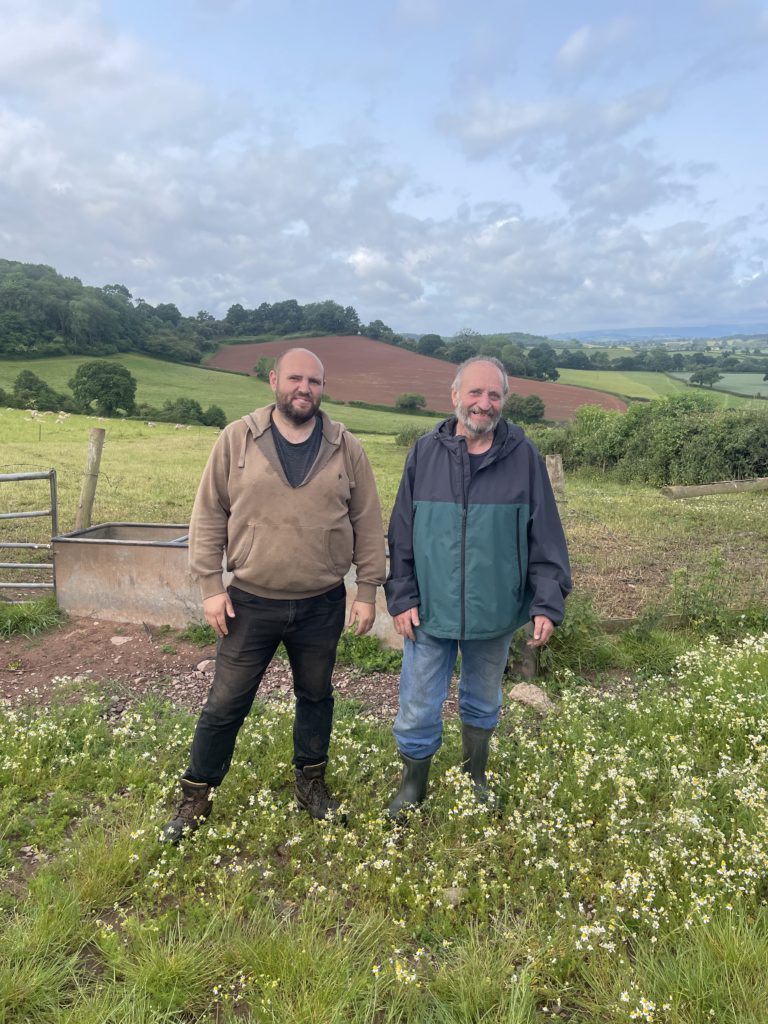
Integration of livestock into arable rotations
Anna Jackson, host farmer at The Pink Pig, and John McArthur, a beef farmer, discussed the challenges and opportunities of integrating livestock into arable systems. Both shared practical insights into how mixed farming can build resilience, improve soil health, and strengthen business performance.
Key takeaways:
Integration builds resilience — livestock can enhance soil health, manage weeds and diseases, and support system stability
Low-input livestock systems reduce costs and simplify management
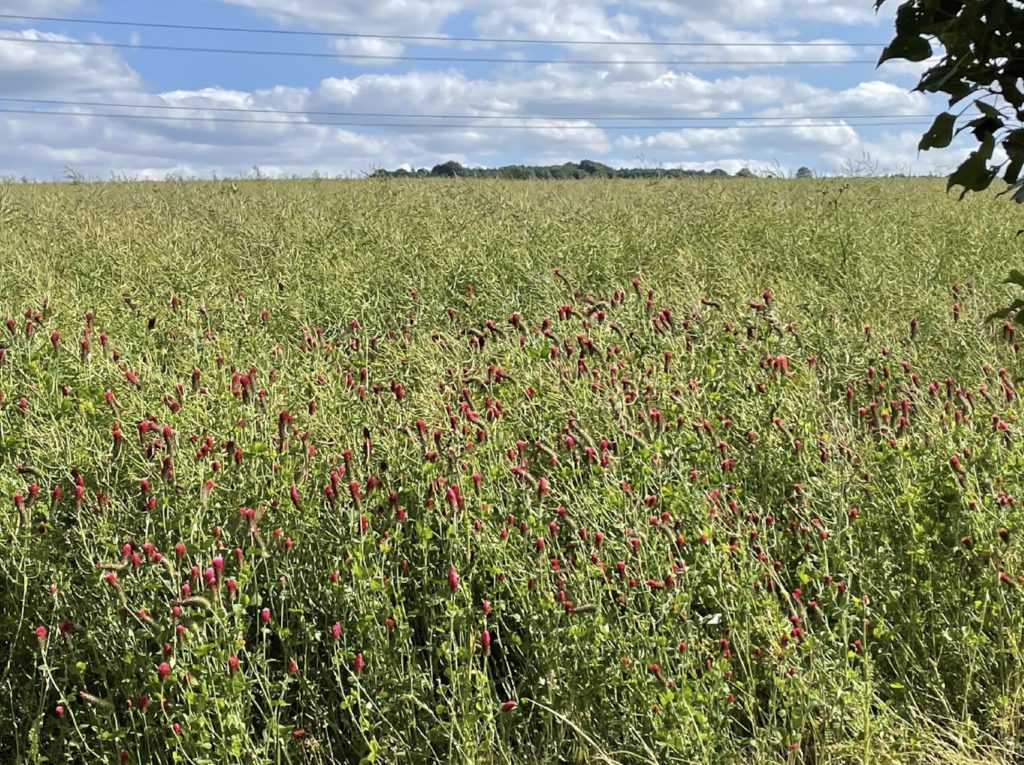
Pulse crops offer dual benefits for arable and livestock systems, cutting carbon and improving nitrogen cycling
Support mechanisms are still limited — longer-term policy and investment will be vital to accelerate change
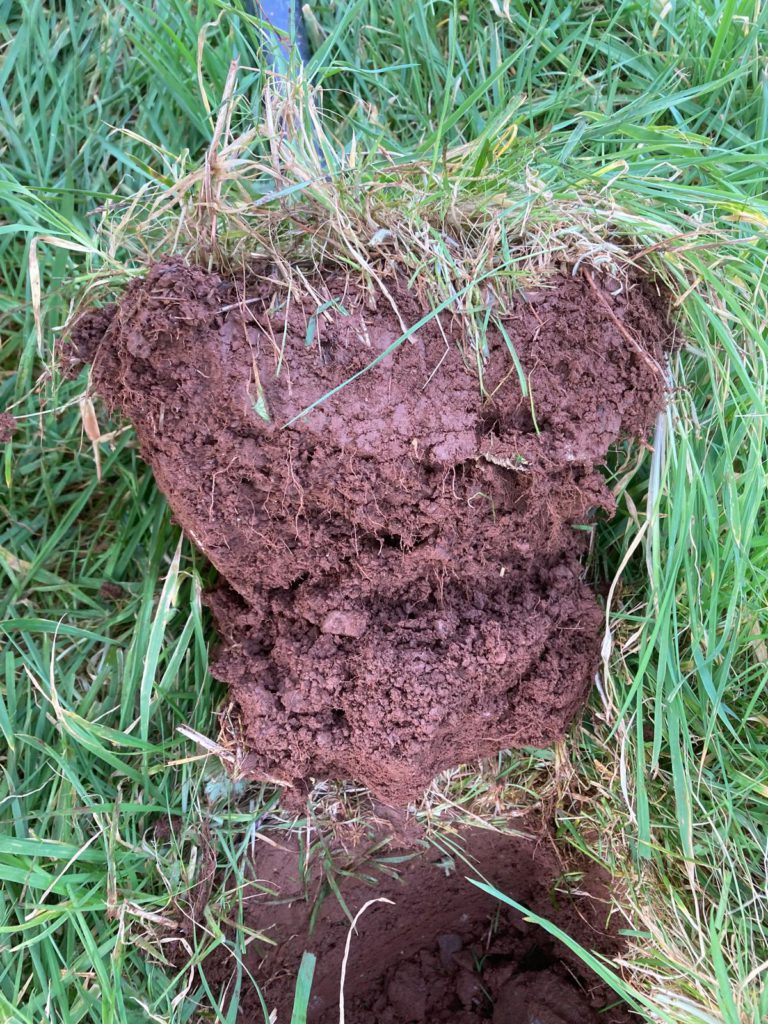
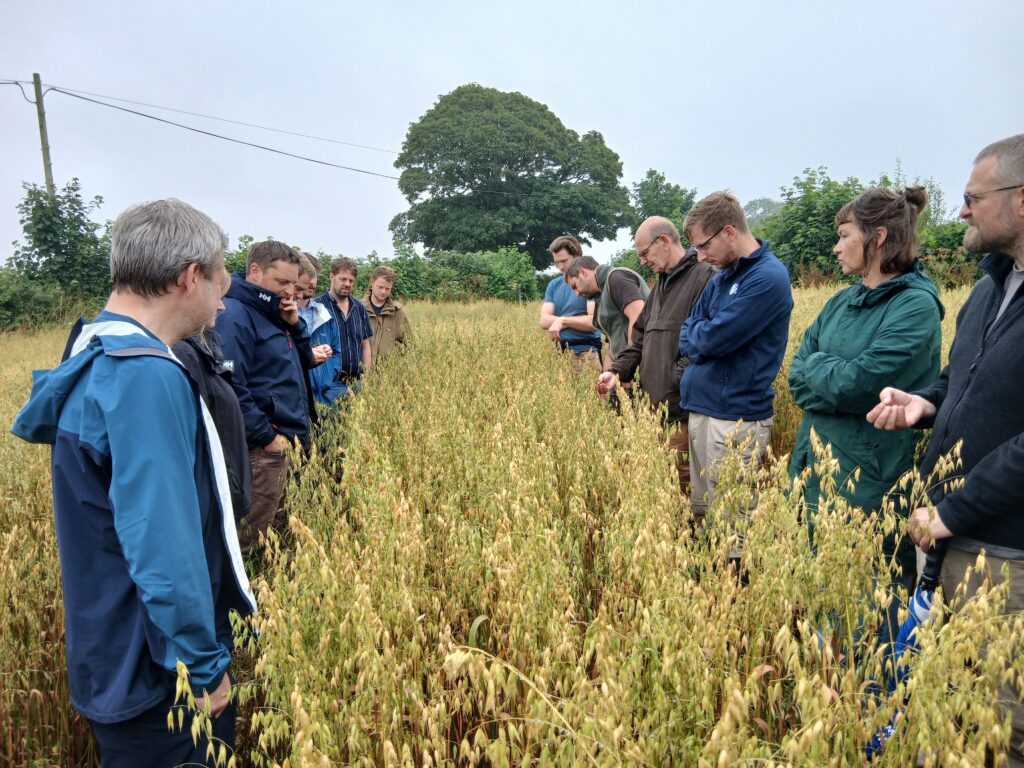
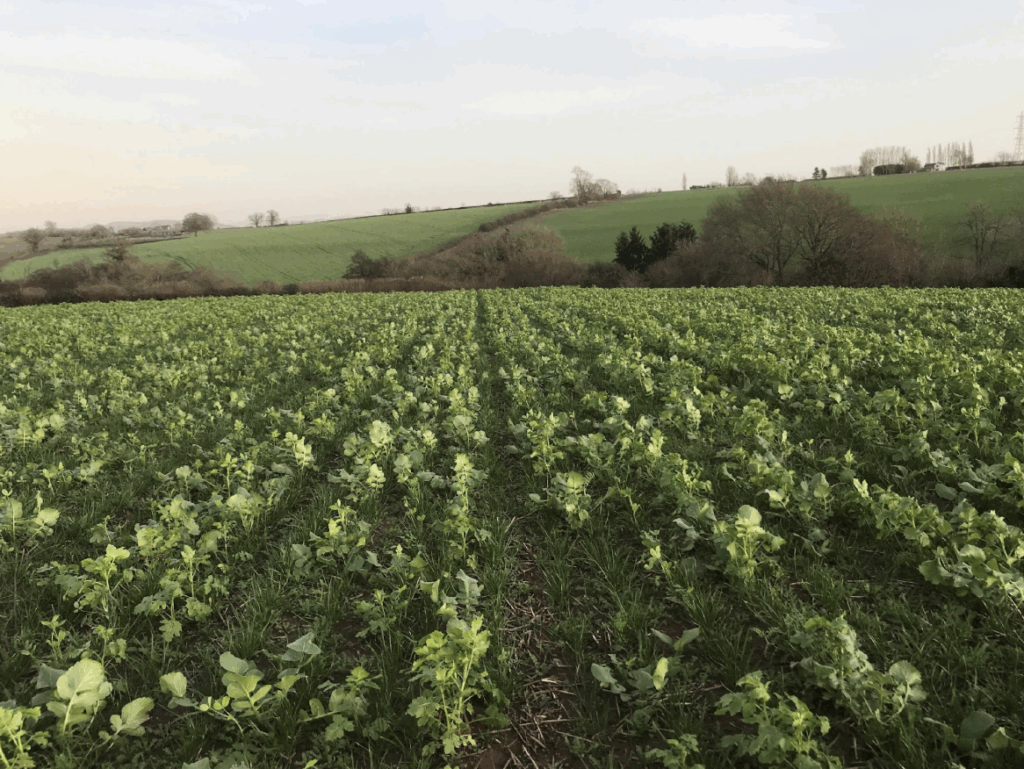
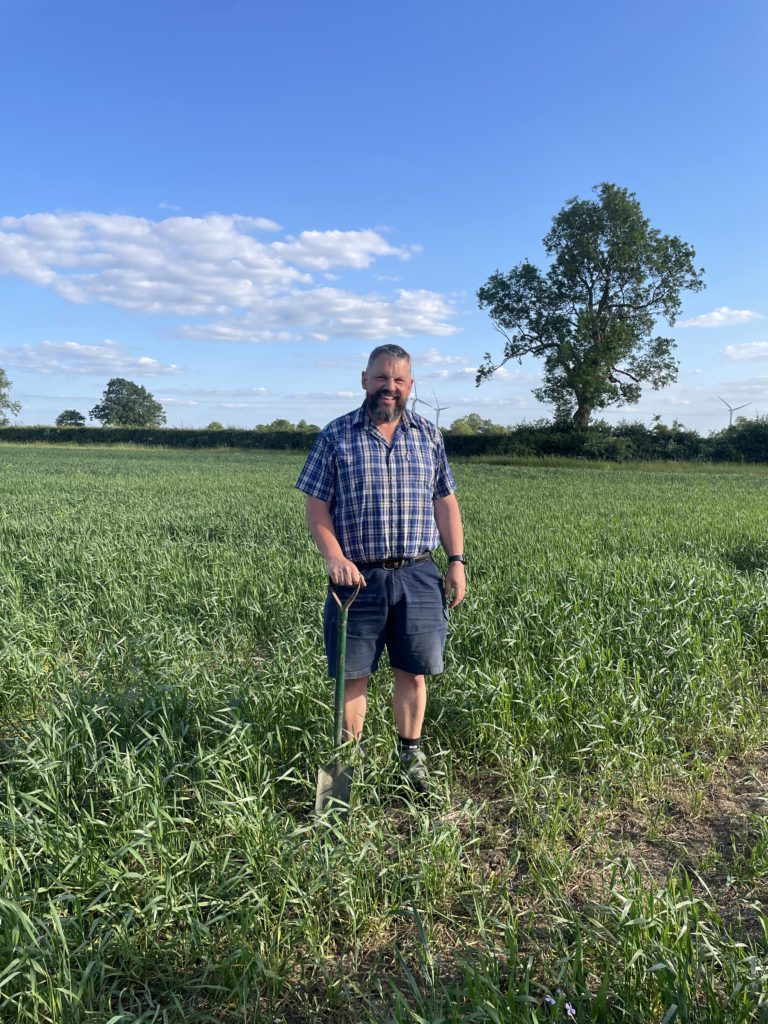
The Importance of Soil Health
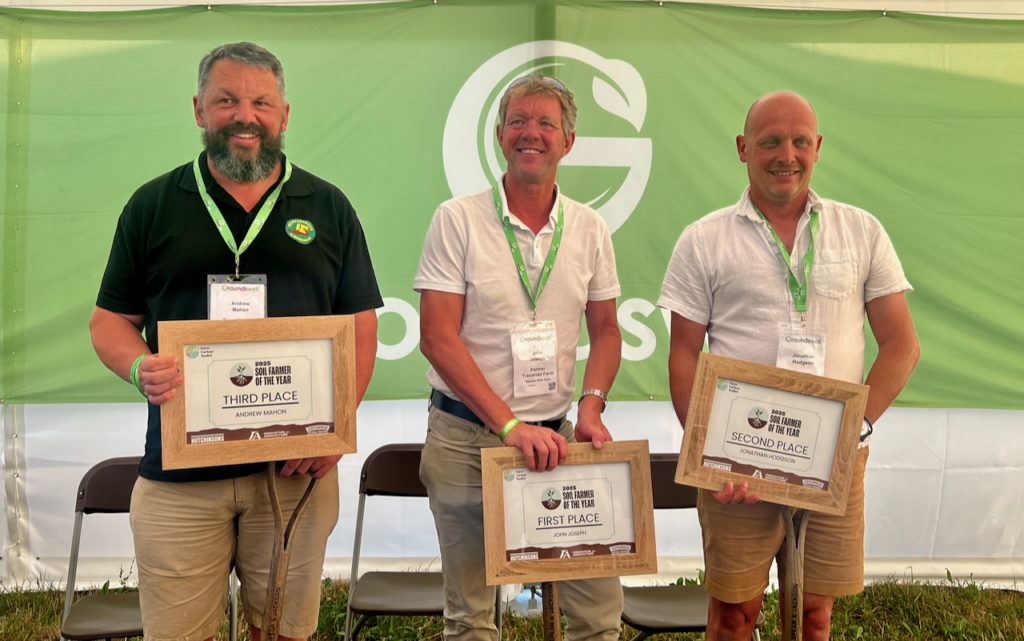
Healthy soil is the foundation of resilient, profitable farming. The second stop on the recent farm walk focused on this essential theme, featuring a soil pit demonstration and insights from Jonathan Hodgson, one of FCT’s 2025 Soil Farmers of the Year.
Stefan Marks from the Farm Carbon Toolkit highlighted the value of regular soil assessments — digging holes, examining structure, and counting worms — as key indicators of soil health and system performance.
Key Takeaways:
Get to know your soils through regular assessments – dig holes to understand soil structure and soil life
Diversity of cropping helps to improve soil health, including keeping soils covered and bringing grass into the rotation, bringing livestock in where possible
The results are tangible with crops handling drought stress better than before as soil health improves
Applying nitrogen “little and often” in line with plant requirements really pays dividends with lower overall use and yields maintained
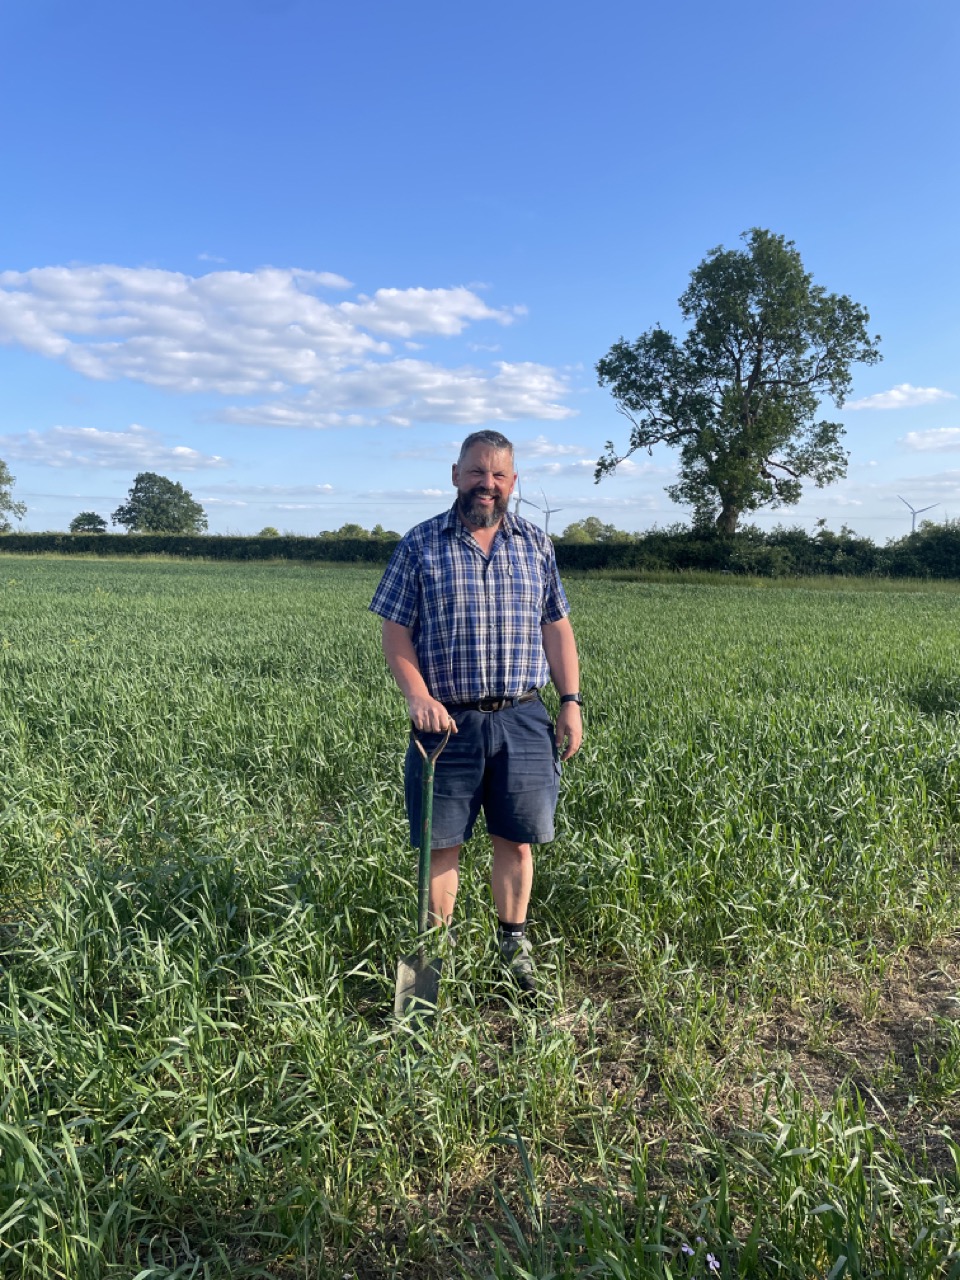
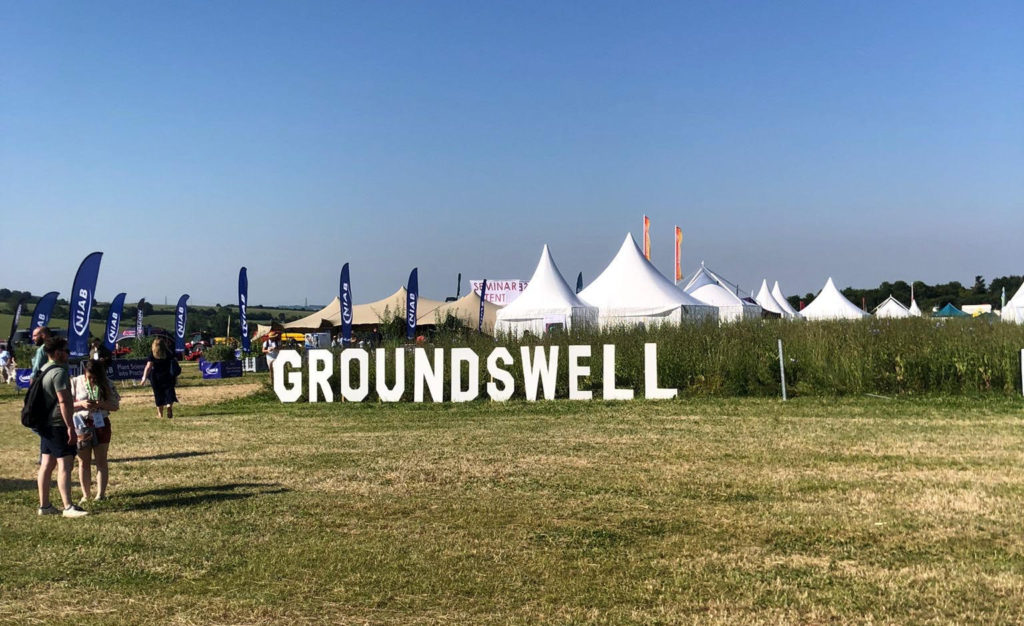
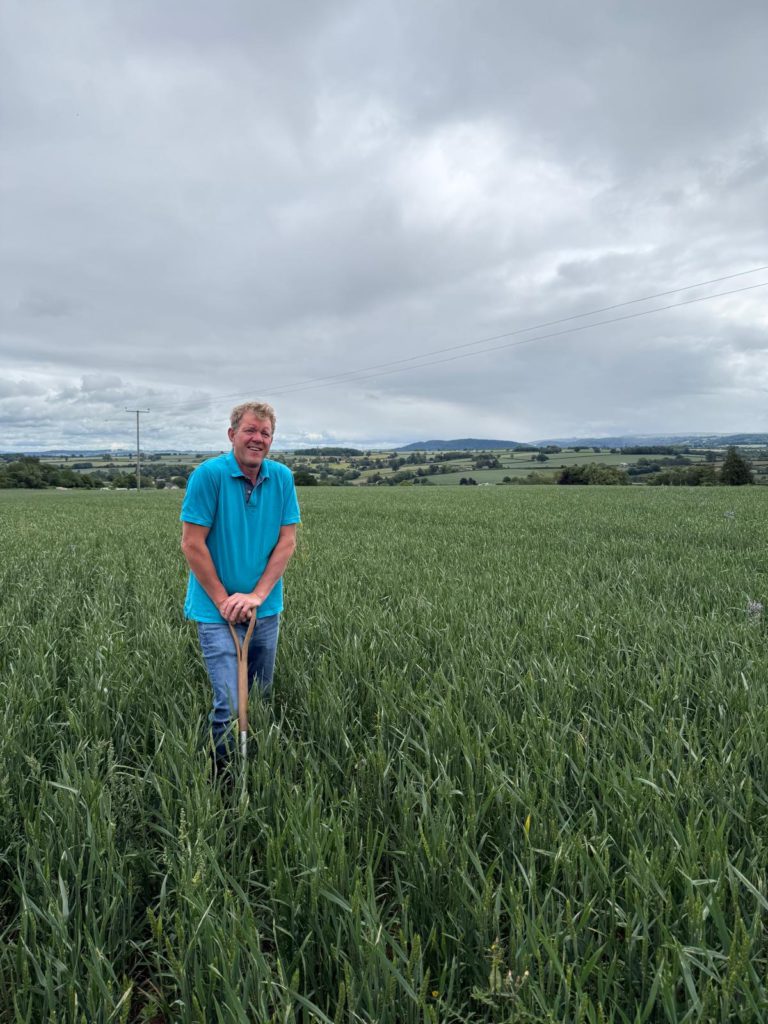
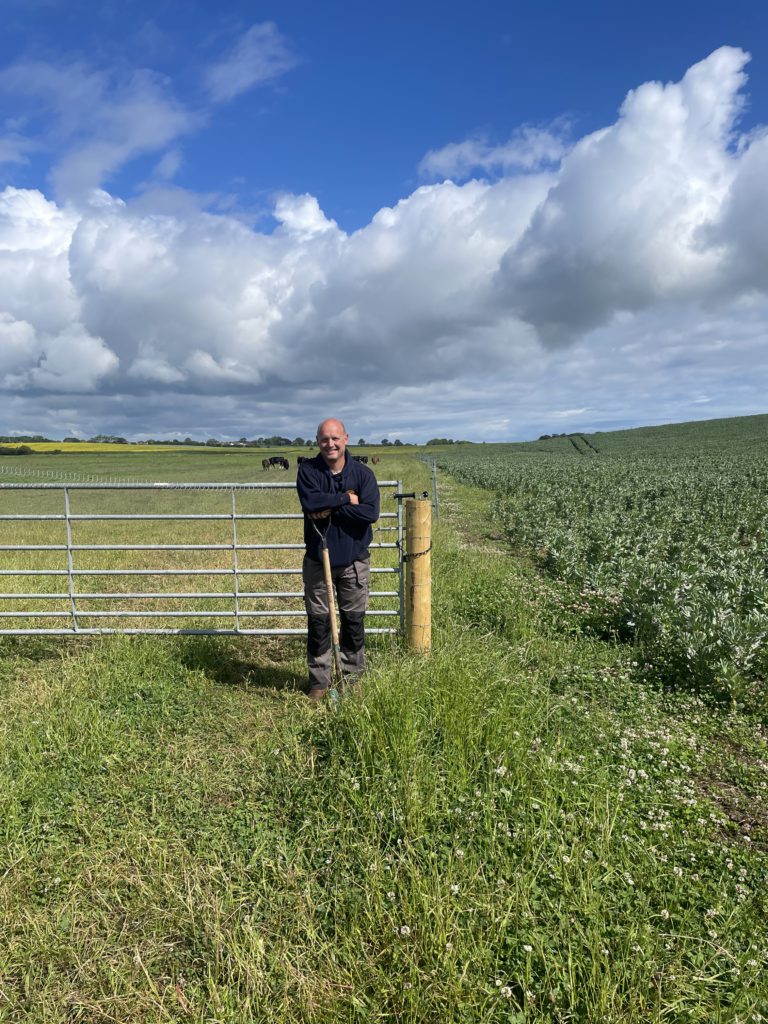
Regenerative Farming: Ten Years On
John Cherry farms 350 hectares of combinable crops alongside a herd of 120 Shorthorn beef cattle, having fully transitioned his farm to a regenerative system. He is also the co-founder of Groundswell, an initiative that brings farmers together to share ideas and learn from each other.
Key Takeaways:
Risk reduction– Through following regenerative farming systems, John Cherry has reduced exposure to risk
Trying to mimic nature – Observing how nature works and using this is key to successful regenerative farming success
Introducing cattle into the arable rotation – Provides manures , which reduce the need for phosporous and potash purchases and improve soil health
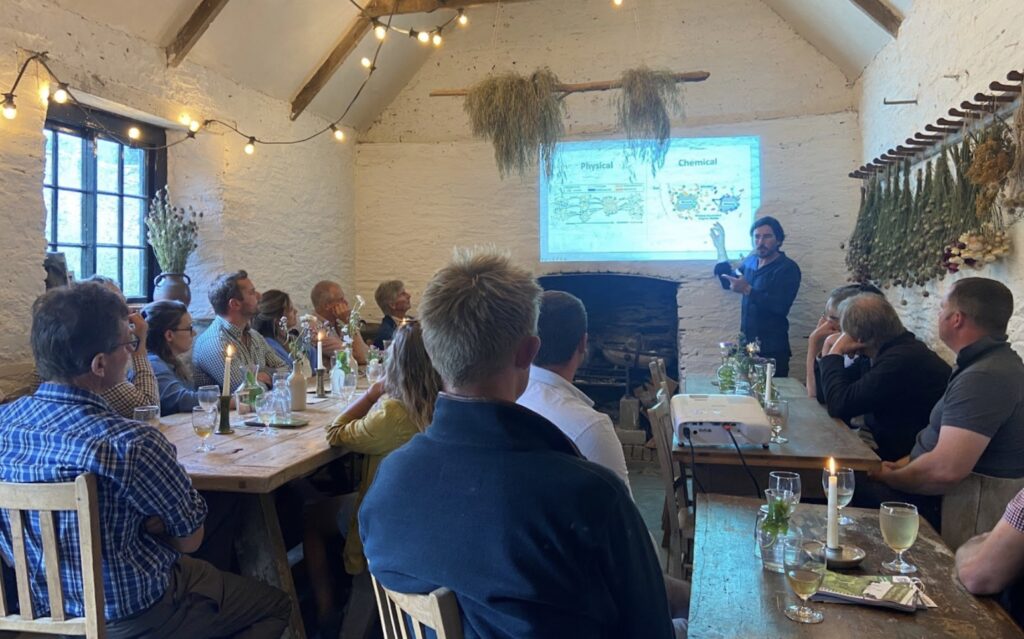
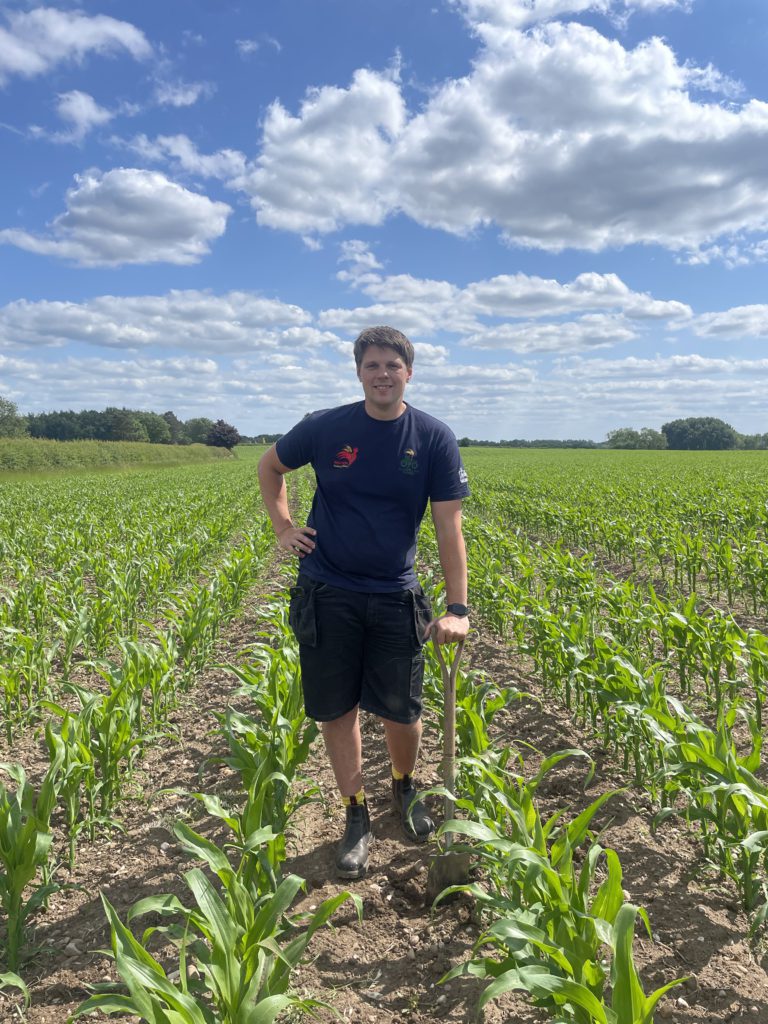
Plant Nutrition Station: Diagnostics and Low-Input Management
Tim Parton (a plant biology-focused farmer since 2012) and Anthony Ellis reinforced the regenerative theme, focusing on precise diagnostics and the minimisation of chemical inputs to control disease.
Key Takeaways:
Dangers of applying nitrogen in large “dollops” – This is the biggest cause of plant disease, often leading to the need for follow on fungicide treatments
Benefits of grazing crops over winter – Sheep grazing can reduce the need for fungicides
Enhanced and balanced soil biology pays off – for arable crops equal ratios of bacteria to fungi is ideal

If you would like to speak to us about how you can adapt these practices for your farm business please contact FCT on info@farmcarbontoolkit.org.uk or phone us on 07541 453413


Recent Comments