We are delighted to be able to invite you to attend this Farm Walk to hear from the team at Lockerley Estate about how they are working to reduce farm-based emissions whilst storing more carbon into soils and non-crop biomass.
Increasingly farming with greenhouse gas emissions in mind, as well as all the other targets farmers work to, is becoming the norm.
Lockerley Estate & Preston Farms, based near Stockbridge in Hampshire is a 2,000ha diverse estate which champions an approach to agriculture where biodiversity, soil health and the wellbeing of the community and future generations is at the heart of everything they do.
Craig Livingstone, Director of Farming & Estates, has four key aims to enable the estate to reduce emissions which are focussed on maximising soil carbon sequestration; reducing reliance on chemical inputs; using the wider estate to sequester more carbon and increasing the natural capital on the estate.
Event details
The farm walk will begin at 1.30pm and will provide an opportunity to find out more about Craig’s strategy to reduce emissions from the estate and how this has benefited the business, leading him to be named as one of FCT’s finalists in our first Carbon Farmer of the Year Competition.
The event will take place outside, please wear suitable clothing and footwear. Light refreshments will be provided.
How to book
This event is free but spaces are limited. Please book via our Eventbrite page by following this link.
Integration with Livetrace will allow automated carbon footprinting of the potato sector.
Farm Carbon Toolkit is delighted to announce the development of an integration between LiveTrace and the Farm Carbon Calculator softwares, underpinned by our longstanding collaboration with Mercian Ltd, the UK’s largest supplier of Crisping Potatoes.
Farm Carbon Toolkit is using its years of experience in Carbon footprinting to support carbon calculations on LiveTrace’s existing platform, bringing additional insights to the crisping potato supply chain and building on the joined-up approach LiveTrace provides for the industry.
Photo: Kai Oberhäuser, Unsplash
Farm Carbon Toolkit’s Calculator Development Manager Dr. Lizzy Parker explains the motivation behind the collaboration.
“For over a decade, the Farm Carbon Calculator has supported farmers to understand their business through a carbon lens. Farmers are all at different stages on their carbon journey, but we believe an important first step is to get farmers thinking about the options they have to reduce emissions and remove carbon from the atmosphere. By working with LiveTrace to bring insight to farmers who are already collecting the bulk of the data they need to calculate their carbon footprint, we can support a significant proportion of the industry to understand its role in reducing emissions“
We have worked closely with Mercian Ltd to improve our calculator for one of the most important agricultural sectors in the UK. We’re now excited to see how a more seamless user experience will support more farmers and their customers to engage with action to reduce emissions.”
“As the largest supplier of crisping potatoes in the UK we felt the time was right to take the initiative” explains Jon Kemp, Director of Livetrace. “The input we received from Farm Carbon Toolkit has been both professional and very much inspirational for us. This has led to a joint approach that is building our understanding of the carbon intensity within the crisping potato supply chain. We have leveraged the data which is already being collected by the LiveTrace software as part of the everyday farming activities, together with FCT’s expertise to understand the carbon impact and guide farmers to more sustainable practices.
We are truly hoping that technology such as this will help the UK potato industry play its part in the positive changes which are taking place across agriculture. “
About the Farm Carbon Toolkit
Farm Carbon Toolkit is an independent, farmer-led Community Interest Company, supporting farmers to measure, understand and act on their greenhouse gas emissions, while improving their business resilience for the future.
For over a decade, Farm Carbon Toolkit has delivered a range of practical projects, tools and services that have inspired real action on the ground. Organisations they work with include Velcourt, the Duchy of Cornwall, First Milk, Tesco and WWF. The Farm Carbon Calculator is a leading on-farm carbon audit tool, used by over 7,000 farmers in the UK and beyond. To find out more visit www.farmcarbontoolkit.org.uk
We created one of the first tools (Farm Carbon Calculator) to audit GHG emissions on farm in 2011 and were one of the first to include carbon removals as well as emissions within our audit.
For further information or to start your first carbon footprint visit calculator.farmcarbontoolkit.org.uk
Looking back at 2023, it can safely be defined as a challenging year with the wettest autumn / winter we have seen for decades. Farmers have not only faced the challenge of maximising yields and optimising soil health, but also battling against the elements to drill crops into the ground. Hoping for a kinder 2024, this blog explores options to build resilience into crop rotations aiming to cultivate a balance between high yields and optimum soil health.
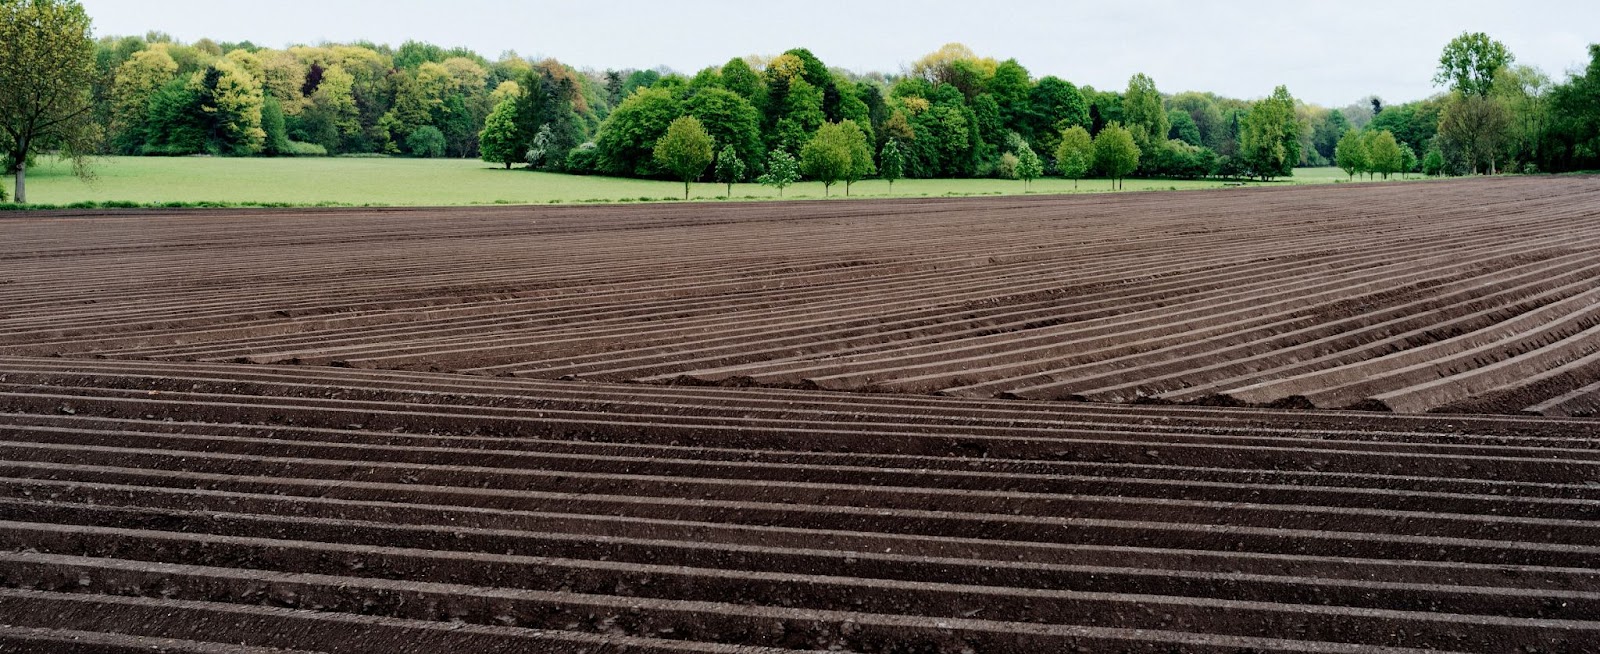
Minimising cultivation
First things first, this blog is not telling you to get rid of the plough. All machinery serves a purpose, it is just about knowing when to intervene. Within systems that have reduced their cultivations or those that have been adopting conservation ploughing (i.e. ploughing one year in three or more), soils tend to be more resilient through improved soil structure. Good soil structure has a matrix of small, medium, and large pore spaces able to retain and drain water as well as provide pockets of air for respiration and gaseous exchange and water for nutrient exchange. When we till the soil, especially when ground conditions are sub-optimum, we run the risk of squashing the pores and causing compaction and soil degradation, reducing water infiltration, increasing anaerobism (lack of oxygen) and building up toxic gases, all contributing to poor soil health and disappointing crop yields.
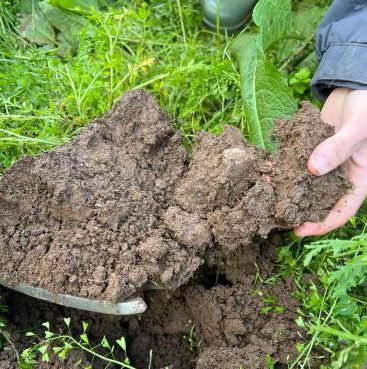
Carry out a VESS: Visual Evaluation of Soil Structure
It is important to get out there and dig holes; get to know your soil and how it behaves under certain environmental conditions. When you assess the soil structure, look for compaction and note its depth. Can this be remedied by deeper rooting species, or does it require mechanical intervention? Always keep the depth in mind as it’s no good going in too deep or too shallow.
Diversity
Sustainable rotations begin with diversity. A multipronged approach combining arable crops, legumes and cover crops takes full advantage of all the tools we have in the box as arable farmers. Diversity in species above ground matches diversity in species below ground: helping to break pest and disease cycles and improve soil health through provision of various rooting architecture, root exudates and crop residues. The soil is alive and many of the nutrients available to crops and plants come from the activity of soil-dwelling organisms that are busy stabilising, consuming and releasing nutrients for the benefit of the crop. Diversity in crops and roots therefore contribute a rich source of food for soil fauna to feast on, enhancing soil fertility and subsequent crop health and crop yield.
Where pests and disease more commonly thrive is within monocultures e.g. continuous cereals. We are seeing an increasing reliance on chemicals to control and abate problems within these systems, depleting our soils of beneficials in the process. Similarly, a lack of diversity in roots are only supporting a limited community of microorganisms. This is not sustainable; therefore, we must explore how we can incorporate more species within the rotation. OSR is one of many good examples. It has deep roots and is easily diversified with companions e.g. vetch / buckwheat / berseem clover. Maximising the number of crop species in a rotation will optimise the diversity of organisms below ground.
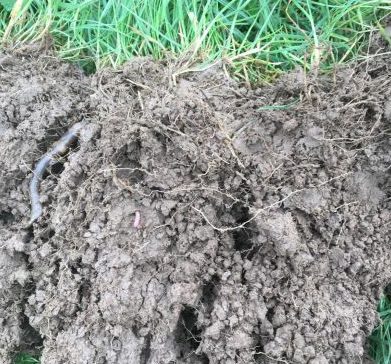
On farm, an easy way to measure how biologically active our soils are is by monitoring earthworm numbers. Earthworms are at the top of the soil food web and will travel to and reside where there is lots of food; they are also brilliant at breaking down residues and redistributing nutrients throughout the soil profile. How many worms do you count in a spade full of soil? Where are you finding the most? And can those numbers be replicated elsewhere on farm?
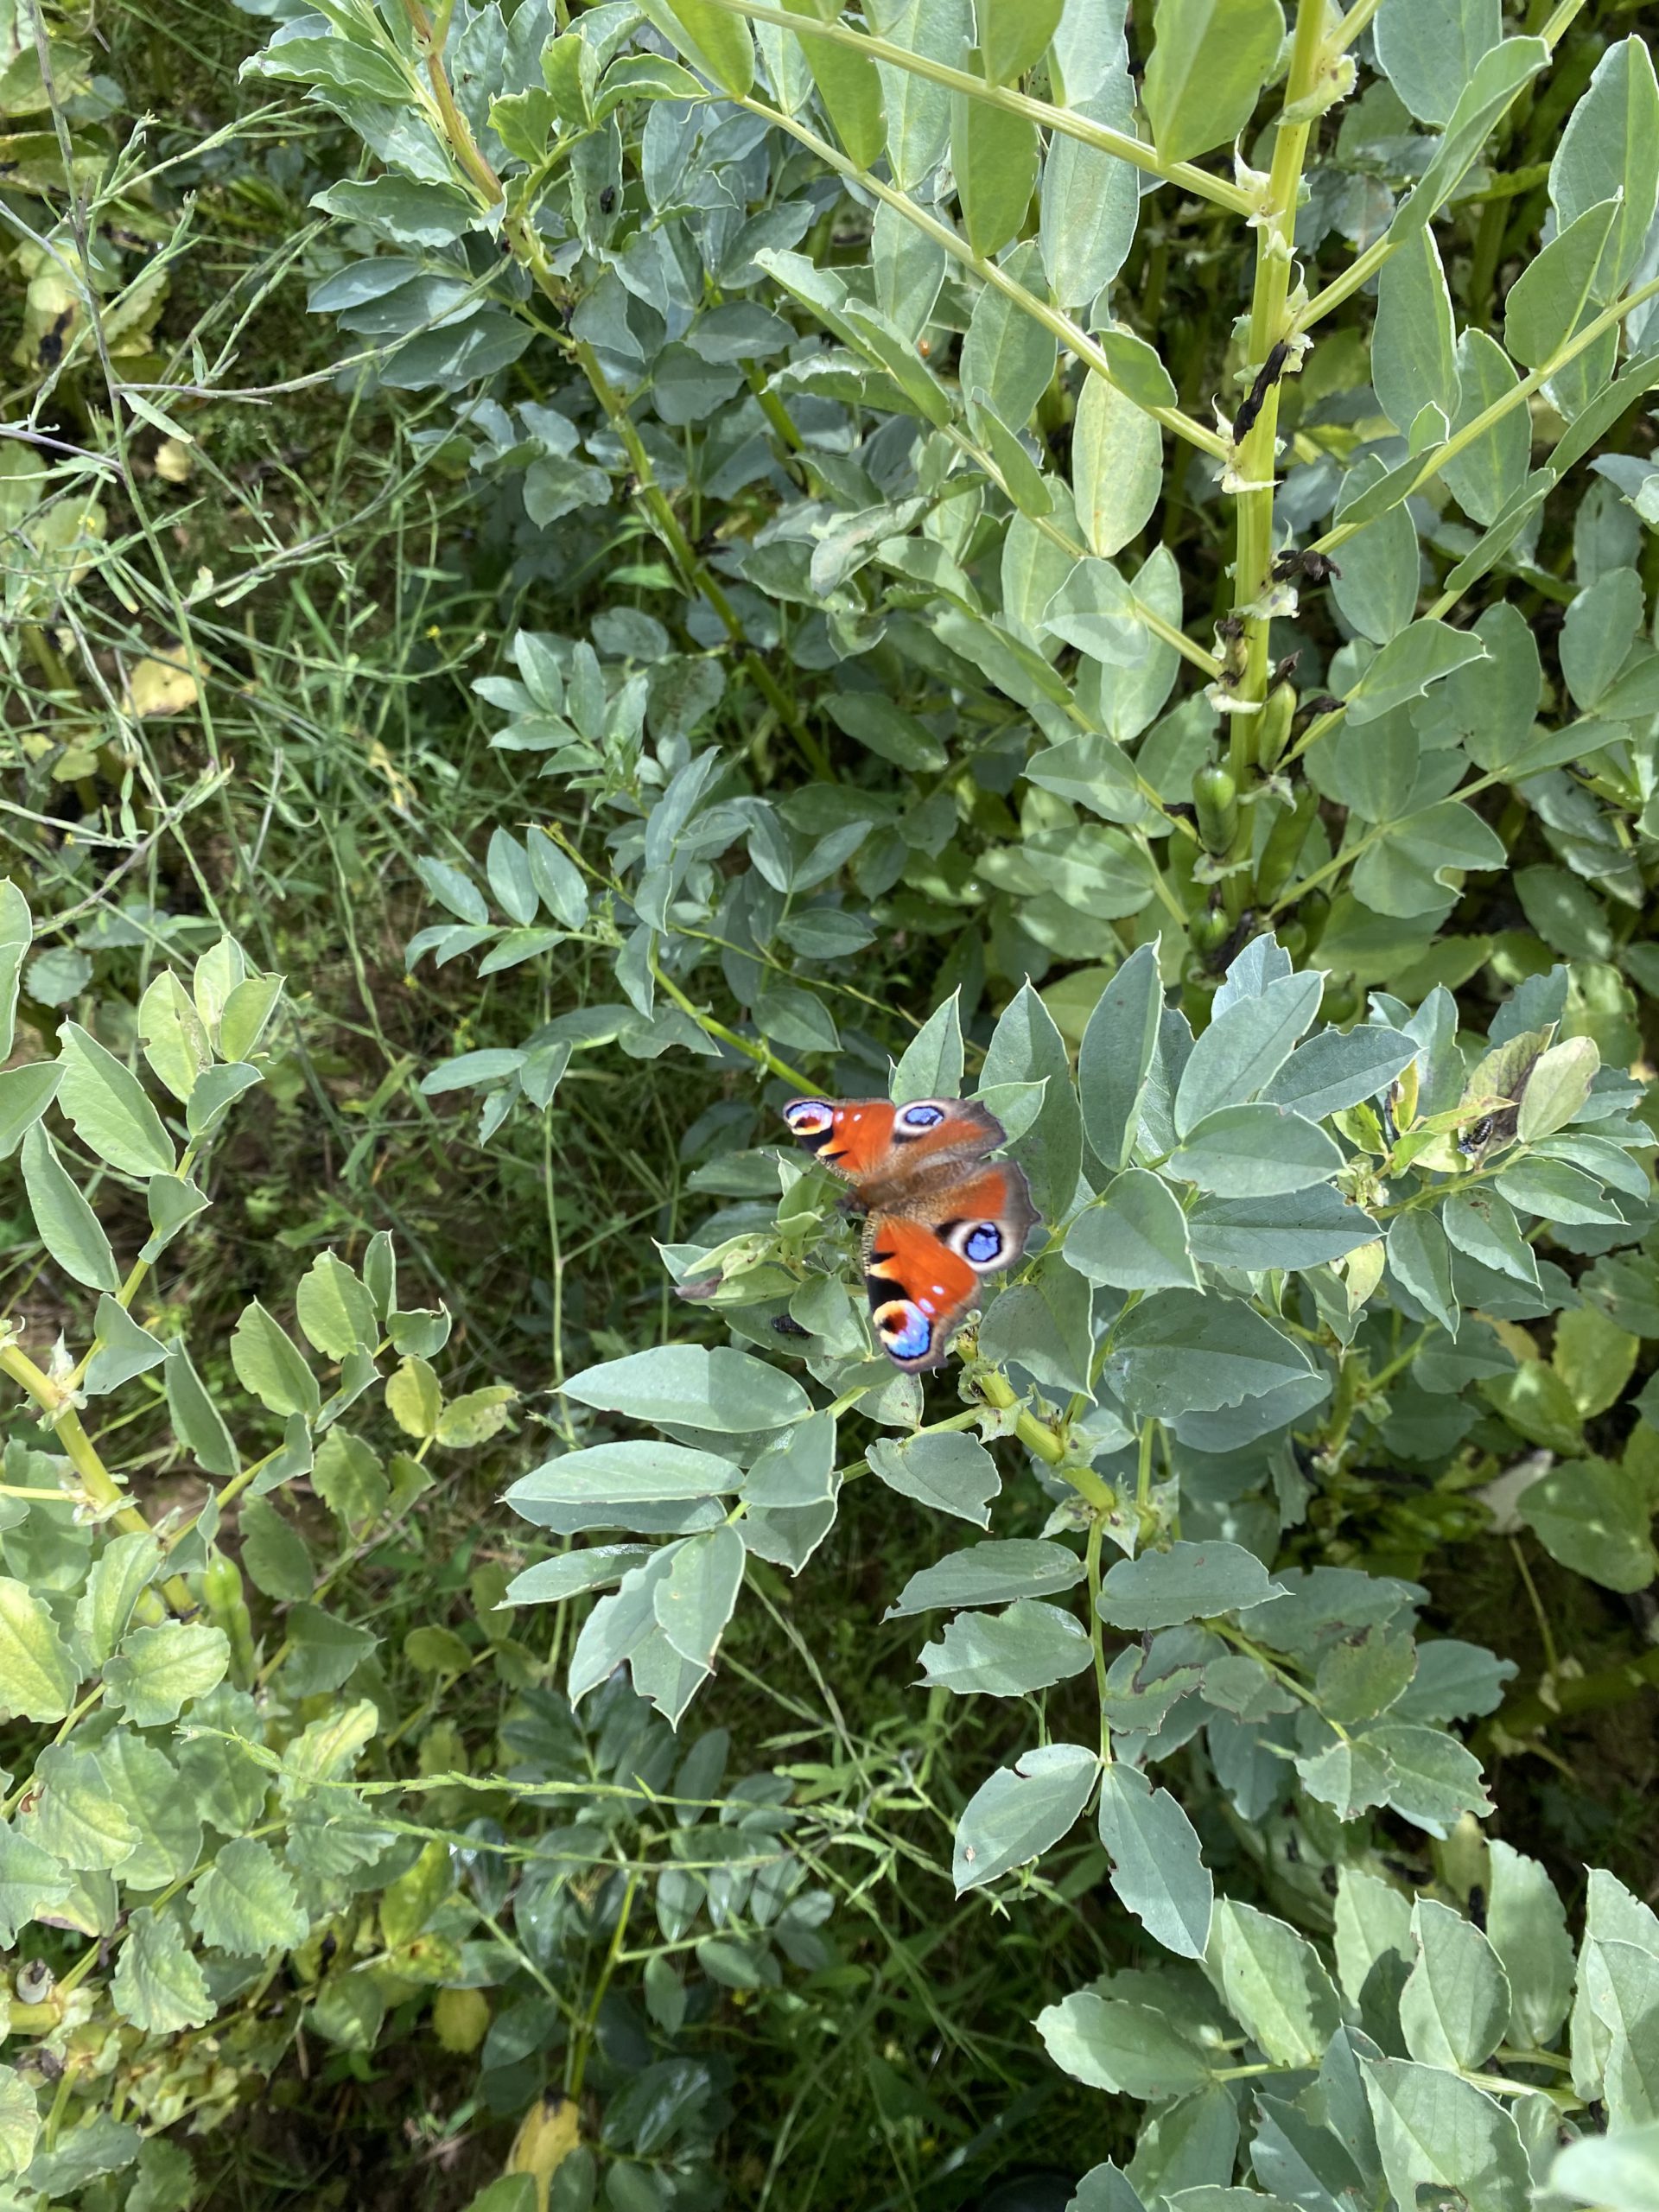
Legumes
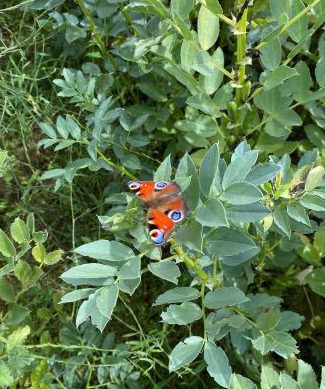
The blog wouldn’t be complete without talking about legumes. Approximately 78% of the air is nitrogen. If we can harness the power of leguminous plants to fix some of that nitrogen, we can cut costs by reducing the amount of artificial fertiliser whilst also minimising our environmental impact. Consider incorporating peas or beans into the rotation as stand-alone crops, clover as a companion crop or include legumes as part of a cover crop mix. Farmers are often able to reduce the amount of bagged fertiliser used after legumes.
Legumes to build fertility: field beans in an arable rotation
If possible, trial a small reduction across a proportion of the field first and see how your yields fare – you might be pleasantly surprised.
Cover Crops
Utilising cover crops between winter and spring cropping is an excellent approach to building soil health in between cash crops: stabilising soil structure by maintaining living roots in the soil throughout the year, feeding the soil biology and acting as a buffer protecting the soil from adverse weather conditions.
On top of this, one of the biggest advantages of cover crops is that they are great at scavenging and holding onto residual nutrients left over from the previous crop, reducing losses from leaching. Once destroyed, the nutrients will be released back into the soil, improving nutrient use efficiency, and potentially enabling a reduction in artificial inputs required by the next crop.
Cover crop mixes should be tailored to your needs and soil type. It’s better to choose species type based on what you are trying to achieve: building fertility, keeping the ground covered, and/or alleviating compaction.
If possible, conduct trials and aim to include 3 or more species in the mix to capitalise on diversity in both the above-ground biomass for optimised photosynthetic potential (think assortment of leaf shapes to increase surface area from which to harness the sun’s energy), and below-ground biomass through varied rooting structures, depths, shapes and sizes (pumping sugars and carbon into the soil, building soil organic matter and feeding the soil biology).
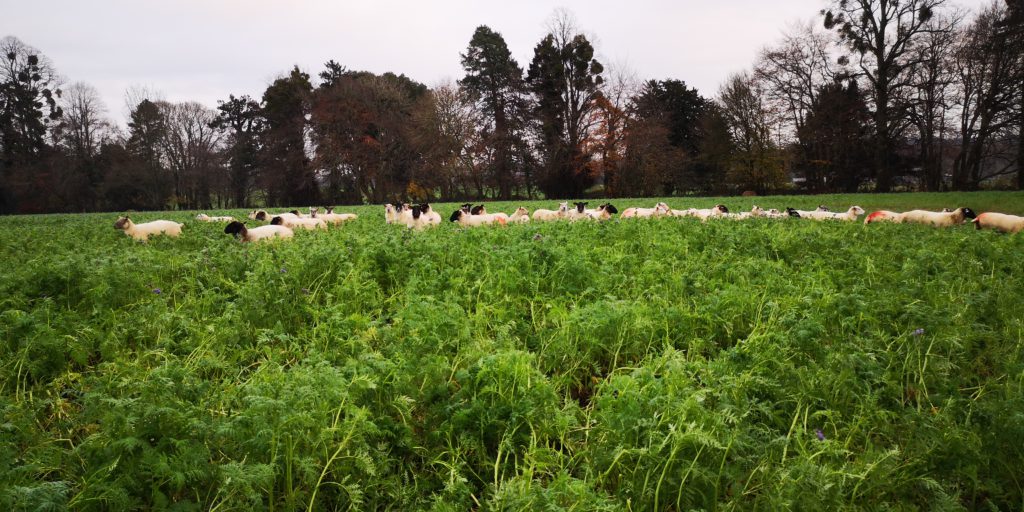
Livestock Integration
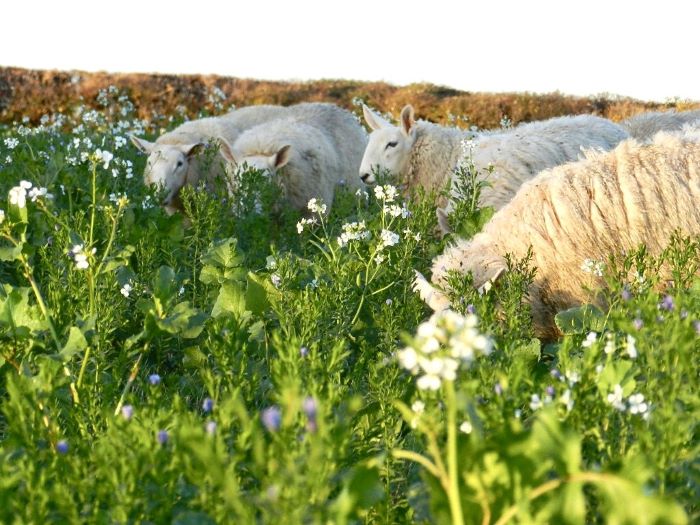
Integrating grazing livestock into your rotation offers an alternative technique to destroying cover crops whilst also adding valuable organic matter to the soil in the form of manure. Including grass and clover leys also gives the ground a break, allowing time for recovery and offers another income stream from grazing or silage / hay making. The benefits of perennial roots in the ground over an extended period, especially if a mix of roots at different depths, will help to improve soil structure and build fertility for future crops.
Grazing livestock returning soil organic matter and building soil health.
Explore the Sustainable Farming Incentive options to see if herbal leys or a 2-year legume fallow could be economically viable.
Monitoring and Adapting
It is important to remember that there is no one-size-fits-all approach; be adaptive and tailor options to local environment and conditions. Trial different methods and see which suits your system best.
Regularly monitoring soil health, accounting for all nutrient sources, and keeping an eye on pest and disease prevalence alongside crop performance and weather is crucial to make informed adjustments to rotations as needed.
In summary, farmers are in a unique position in that yes, we produce emissions in the process of producing nutritious food however, we can also build soil health and boost biodiversity simultaneously contributing to offsetting our own emissions and future proofing our farms and landscapes. Implementing a sustainable crop rotation in the UK is not just about growing crops; it’s about promoting a future where productivity and soil health co-exist. By diversifying crops, integrating legumes, embracing cover crops, minimising tillage, incorporating livestock, and tailoring practices to local conditions, it is possible to achieve a resilient and sustainable agricultural landscape supporting local and wider communities for years to come.
Carbon accounting is a fast-moving space, and here at FCT, keeping on top of best practices is one of our top priorities. We commission regular external reviews of all our emissions factors to make sure we’re as compliant and up-to-date as possible. And yet even with the best data available, there’s always the possibility of human error (we all do it!) cropping up in a carbon report.
One area we’re particularly keen to address is how to avoid ‘double counting’ when it comes to farming footprints. This refers to counting the same carbon/CO2e in different places, often (but not always) in the same report.
For example, you might record all your freight and logistics fuel use in the ‘Fuels’ section of our Calculator, only to duplicate the entry under the ‘Distribution’ section. This would result in counting the same emissions twice, artificially inflating the total emissions figure.
These errors can be subtle and easy mistakes to make, so it’s worth reading on to find out how to avoid them and embrace best practices.
How is double counting possible?
Our Carbon Calculator has many different emissions factors that you can record, reflecting the wide variety of needs and business profiles in modern farming. Because of the need for informative metrics and KPIs, our Calculator sometimes offers the option to record an emission or offset in more than one section.
You can therefore choose to either record all of the carbon in one section, or to split it out for better insight in your final report. For example, you may want to be able to see the amount of fuel used in farming operations vs. the fuel used in the distribution of goods. Being able to record the carbon in more than one place is crucial to business insight, but it does introduce the risk of error.
If we want to use these informative metrics, then it’s important to be aware of when you might double-count your carbon.
Where in the Calculator might I be double counting?
We’ve listed below some of the most common areas where double counting may occur in our Calculator. For each one we’ve given an example of how it occurs, and the best practice in order to avoid it.
Animal Feeds – Home grown vs. Bought in
If you are growing your own animal feed on-farm, then you don’t need to account for this in the ‘Livestock’ section. To do so would overestimate your emissions. The Livestock section is only for feeds that are specifically bought in.
To avoid the double count: Make sure that anything recorded as a feed in the Livestock section is a bought-in feed. If not, it doesn’t need to be counted there!
Materials vs. Inventory
The Materials section of our Calculator allows you to record a wide variety of items that are used in construction and repair work. Our Inventory section, on the other hand, is there to record larger capital items such as new outbuildings or farm machinery. This difference is key, as any items within the Inventory section will have their carbon impact depreciated over a period of 10 years.
It’s also possible to record your own custom building projects inside the Inventory section. For example, you might choose to record all the materials associated with a new outbuilding. This might be done so that you can achieve a more precise footprint for a non-standard construction.
Where materials are purchased for running or regular repairs of existing installations, record these in the Materials section.
To avoid the double count: Make sure you’re not recording any custom-build projects in both Materials and Inventory. They only need to be recorded in one of these sections!
Sequestration – Double Counting Offsets
If you have previously sold any carbon offsets, for example through soil organic carbon sequestration, then you should not count the offset in your report. To do so would be an example of double counting as the benefits are no longer attributable to your farm business.
To avoid the double count: Make sure you’re only recording potential sequestration that hasn’t been sold or accounted for elsewhere.
If you have entered an area of land under the sequestration option: “Soil Organic Matter” or “Soil Organic Carbon” (using information from soil sampling), you should not also enter those areas of land under other sequestration options (such as Countryside Stewardship Schemes, even if the land is receiving payment for that scheme). Direct soil sampling is preferable in this scenario. Similarly, whilst in practice you can “stack” the payments you receive from stewardship grants, you must only enter areas of land for sequestration under one potential sequestration option (so if “My field” is 5ha, I can enter soil sampling data from those 5ha OR the fact that they are under a Countryside Stewardship Scheme).
To avoid the double count: Include each field area under only one potential ‘Sequestration’ option.
Fuel Use – Distribution vs. Farming Operations
If you want to split out your fuel use into distribution and farming operations, you have the option to record these separately. Any farm fuel use such as red diesel can be recorded under ‘Fuels’. Any fuel used in moving goods can be put under ‘Distribution’.
To avoid the double count: We recommend splitting out fuel use between ‘Fuels’ (i.e. farm operations) and ‘Distribution’.
The Exceptions
As with all good rules, there are some apparent exceptions:
you CAN add multiple crops that have been grown on the same area of land in the same year (but only include those that have been harvested or terminated within the reporting period).
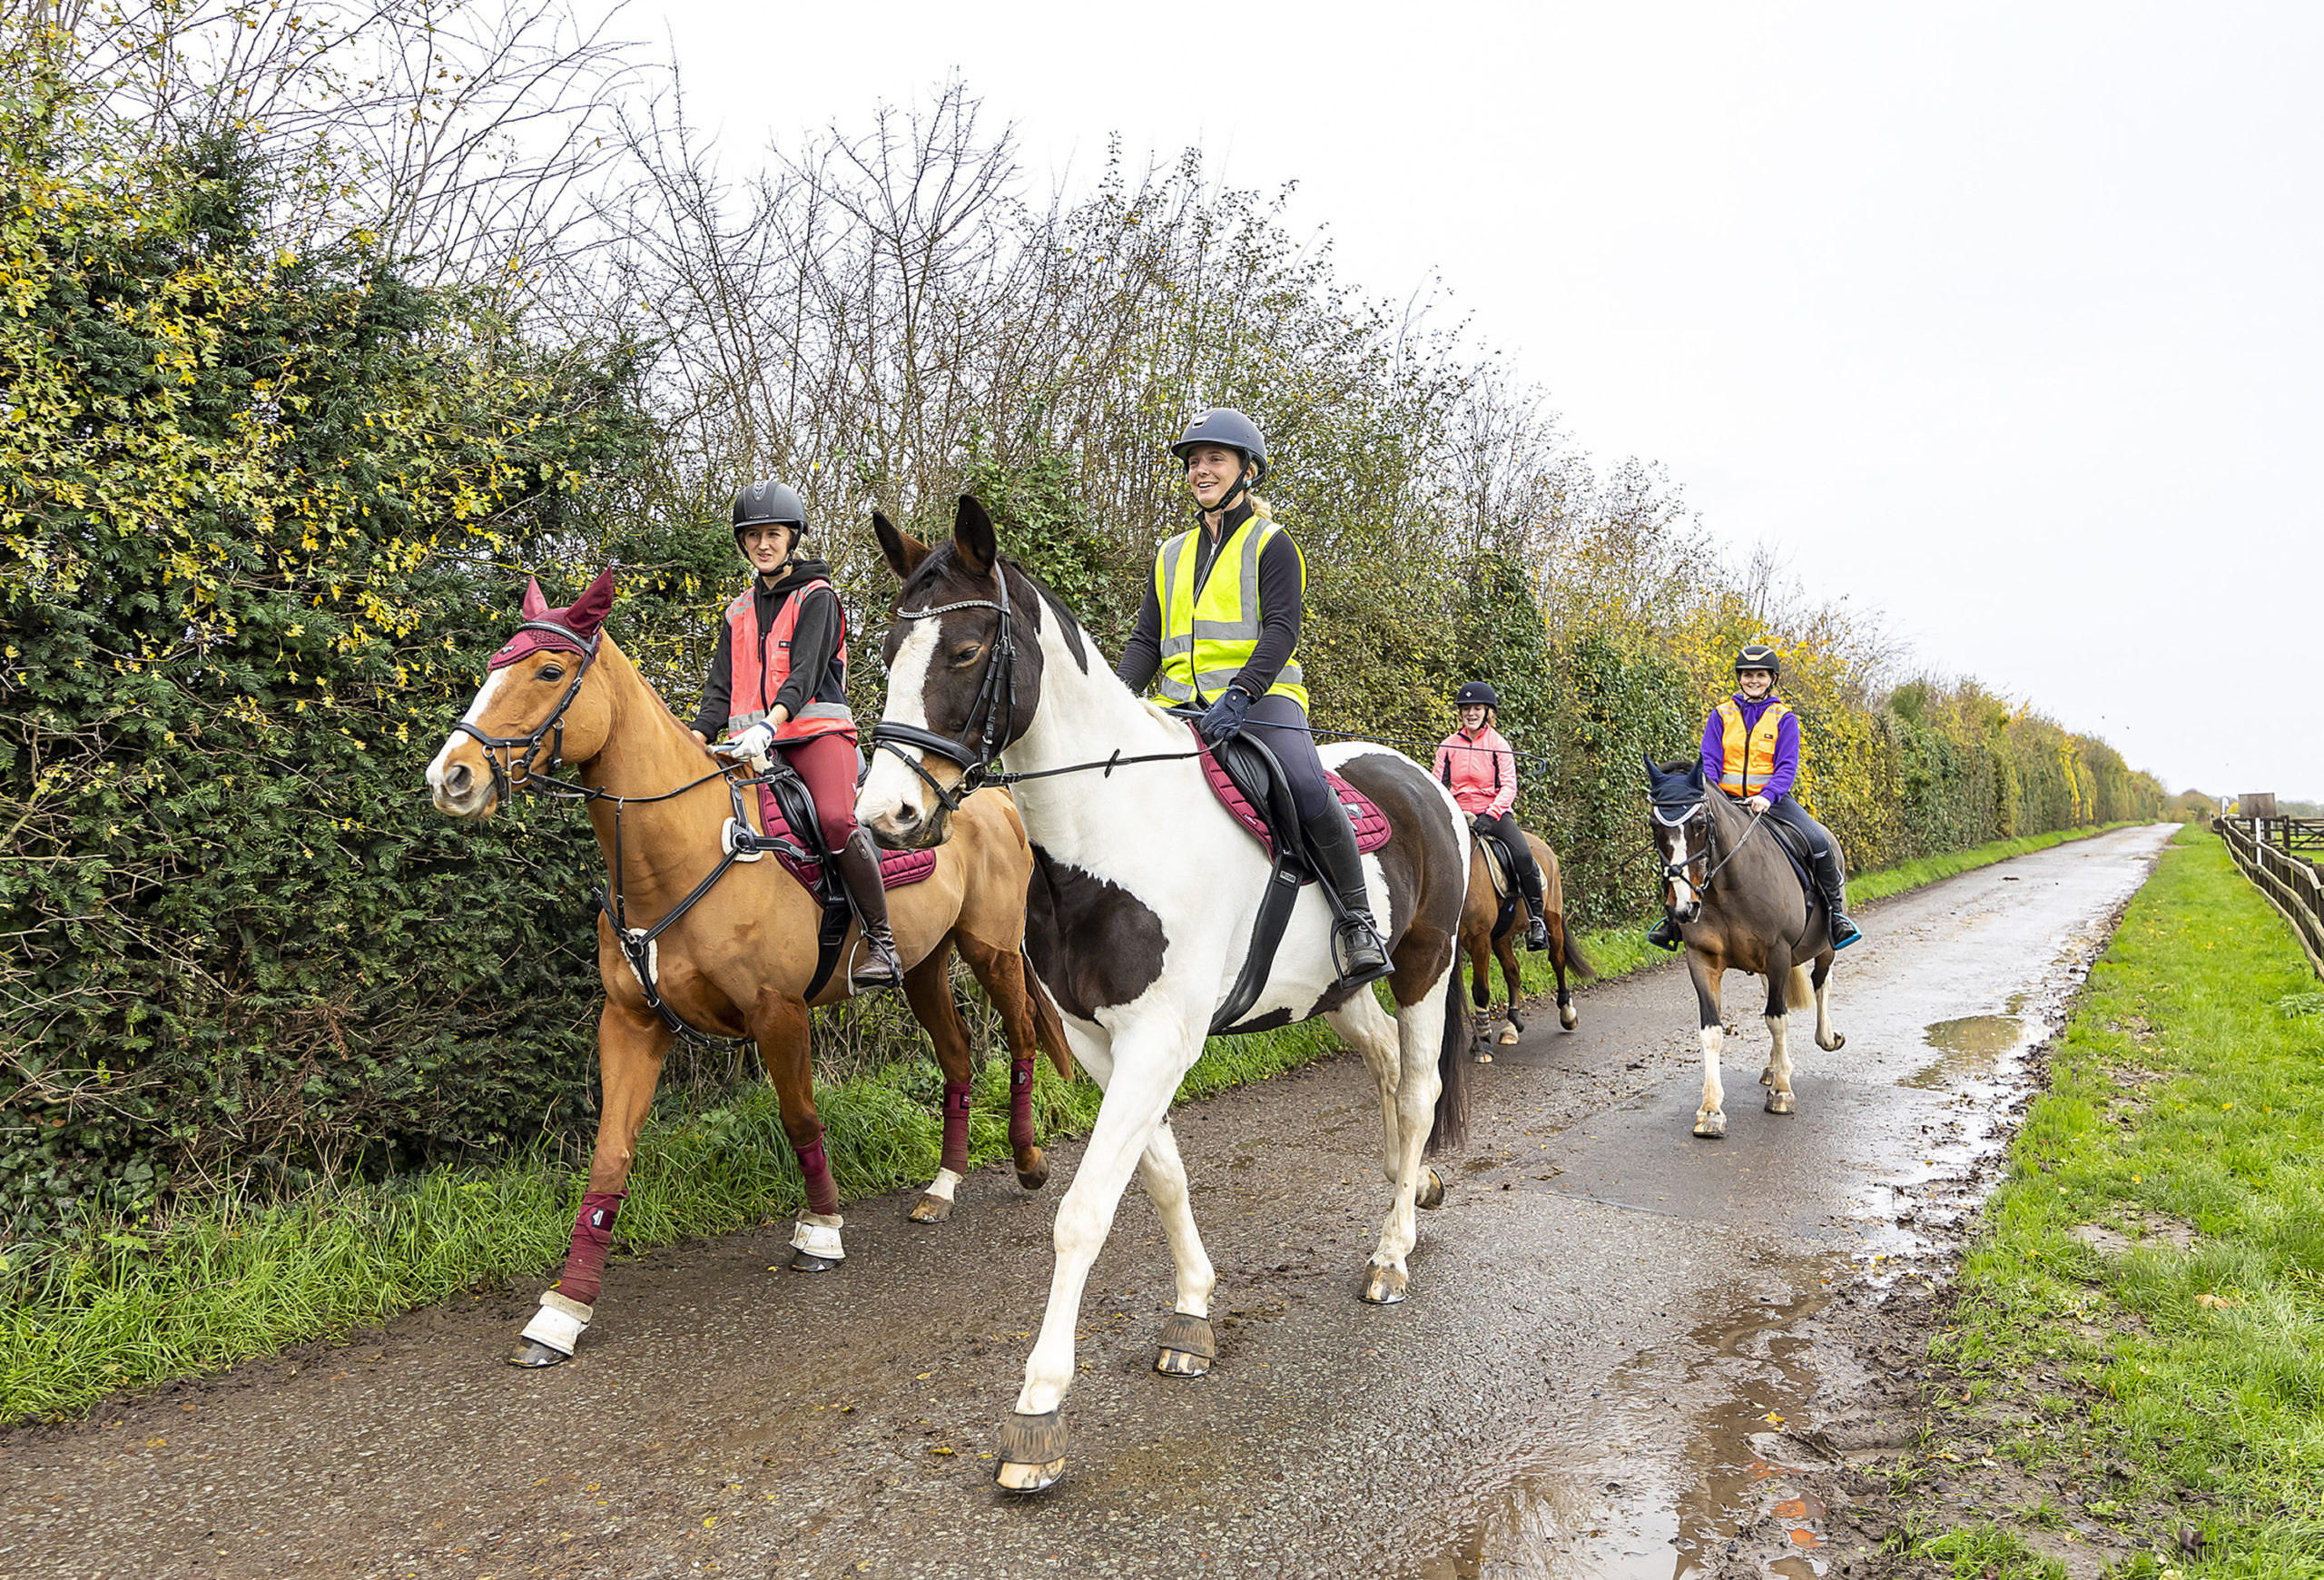
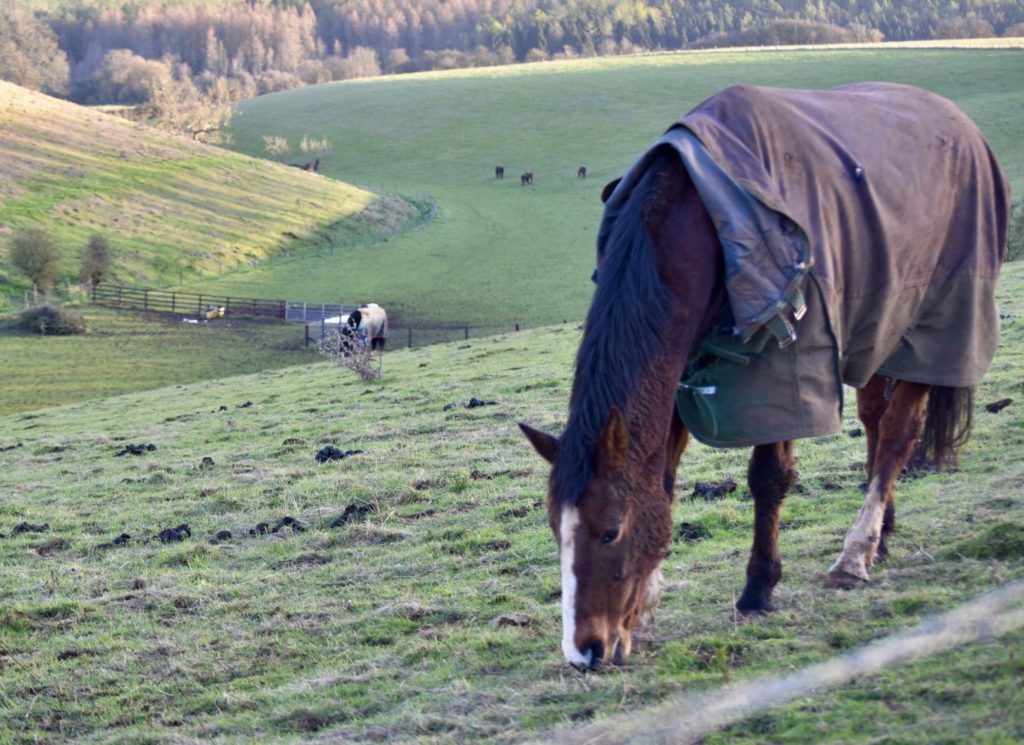
Taking The Reins: Equine Carbon Calculator Launched to Inspire Environmental Action
A consortium of equine organisations is rallying the industry to play a leading role in addressing the climate crisis and shaping a better future, with the launch of the first nationwide equine carbon calculator today.
Pioneered by equine environmental sustainability specialists White Griffin and the Farm Carbon Toolkit, in partnership with Derby College Group, Hartpury University and Sparsholt College Group, the calculator has been developed to empower equine businesses and horse owners to better understand their environmental impact and take meaningful steps to mitigate it.
The free-to-use tool – accessible here – also identifies opportunities for businesses to minimise their energy costs and maximise their potential to regenerate the countryside.
While carbon footprint tools are prevalent in the agricultural sector and play a pivotal role in government carbon reduction targets, no such tools have been available at scale for equine premises until now.
Without insights into the scale of the challenges and opportunities, the equine industry is hindered in setting meaningful targets. The equine carbon calculator seeks to bridge this gap, empowering stakeholders to make informed decisions for a sustainable future.
Director of White Griffin, Ruth Dancer said:
“The equine community holds a deep connection to the natural world, so we have a unique opportunity to safeguard it for future generations. By implementing the equine carbon calculator, we can better understand our emissions and find innovative ways to reduce them, saving money and paving the way for a better future.”
The launch of the carbon calculator marks the beginning of a comprehensive campaign to educate and inspire the equine industry on environmental sustainability. This initiative will be complemented by a suite of resources set to launch in autumn, offering support to stakeholders across the horse racing and equestrian sectors.
It follows a broader industry shift toward a more sustainable future for equestrians and horse racing, underscored by the tangible impacts of climate change on the industry. Following the hottest year on record in 2023 coupled with significant flooding, the UK equine industry suffered multiple cancellations across the full spectrum of events, highlighting the urgency of addressing these challenges.
White Griffin’s previous reports for the British Horse Racing Authority and the British Equestrian Federation, have laid strong foundations for these sustainability initiatives, emphasising the need for tools and resources to support businesses in their sustainability efforts.
“After years of supporting agricultural farms with reducing their environmental impact through a clear and easy-to-use tool, we know how important measuring to monitor is. Our calculator allows equine businesses to properly understand their carbon footprint and make the necessary changes to reduce their emissions.”
The equine carbon calculator is the result of a collaborative effort among academic institutions committed to driving real change in the industry.
The project began when Assistant Principal of Derby College Group, Jon Collins, began work on their own carbon footprint and discovered that while the tool had everything they needed to understand the farm’s footprint, they struggled to use it for their equine yard. Speaking with Sparsholt College Group and Hartpury University, Collins discovered that both organisations were also seeking to develop a tool to support their equine students and businesses and therefore a collaboration was formed in order to pool resources. Collins said,
“I chose Farm Carbon Toolkit to develop the resource because I found their tool to be easiest to use and provided the best user experience. Understanding the busy lives of equine business owners, we knew that we had to develop something that was clear, useful and also provided invaluable insight and comparisons with other equine businesses. We are proud to be delivering this with the support of Landex and will be rolling the tool out to all students, organisations and interested individuals who are seeking to make a difference in their day to day lives to the environment we all depend on.”
Project lead for Hartpury University, Rachel Collins, said: “We’re passionate about sustainability at Hartpury and have worked with both White Griffin and Farm Carbon Toolkit to deliver the most up-to-date training and knowledge to our students on equine sustainability. This tool represents an important step in our commitment to drive the industry forward towards a sustainable future. We are proud to be part of this collaboration, leveraging our expertise to empower stakeholders and effect meaningful change.”
Mark Treagust, Vice Principal of Sparsholt College Group said: “Collaboration within the equine sector is vital to address our industry’s greatest risk – the climate crisis. Leveraging our collective wealth of knowledge in land management and equine welfare, we must support businesses in making impactful changes. This tool initiates a large-scale process for thousands of individuals all over the country. By uniting as academic institutions and utilising the Landex network, we can effect real, much needed change.”
By Liz Bowles, Farm Carbon Toolkit Chief Executive
Having confidence in the accuracy of the Farm Carbon Calculator
In a recent blog post, we explored all the factors that influence the accuracy of carbon footprint, from the data the user inputs, through to the processes that ensure the Farm Carbon Calculator’s calculations and emissions factors are correct, and the ongoing testing carried out. However, like any good service, we understand that you want independent experts to endorse our tools.
Feeling confidence from external experts
Like any good service provider, we actively and regularly seek external review of our tools. In autumn 2023 we asked the independent global climate consultancy, the Carbon Trust to review our Calculator, including the methodologies, calculations, assumptions and factors that underpin a working calculator against the GHG Protocol standards. Following this review, we have developed an Action Plan to address issues identified which will be completed by December 2024.
Alongside this work, Defra commissioned ADAS to look at a number of leading UK Carbon Calculators to improve our understanding of the differences between them and to support methodology harmonisation going forward.Our Calculator was one of those included in the comparison. A key finding from this work was that although there are many ways to complete a carbon footprint inaccurately there is no “one way” of doing it accurately. This is mainly because the different Calculators compared are seeking to answer slightly different questions.
The differences identified were found in the areas of scoping, emissions factors used and standards aligned with
Scoping describes what is measured, and some calculators include things that others don’t. At the Farm Carbon Calculator, for instance, we measure as much as possible of a farm business. This includes, for instance, the embodied energy in buildings and machinery, upstream emissions of various inputs, and gives the option to estimate all potential carbon sequestration on farm. Not all calculators go this far.
There are some standard and some non-standard emissions factors used. For instance, the UK Government produces a comprehensive list of emissions (UK GHG Inventory & Conversion Factors) from fuels and energy, livestock and crops that all calculators will use. But some of the other factors come from a range of other scientific papers and there may be some variability in which ones are used by different calculators. All calculators currently carry out their own research independently of each other.
There are a number of standards that describe what and how to measure carbon footprints. Whilst there are a number of standards that relate to food and farming, there is a lack of consensus over which standard is ‘the one’ to adhere to. We are therefore implementing a process whereby users can choose to align their carbon reports to one of a few recognised standards. This will be available in due course.
Following this report, we are working actively to support higher levels of harmonisation where this is possible to reduce results variability from different Calculators.
Hopefully, this gives you, our valued users, confidence that we are rigorous in our processes, that we conduct regular independent reviews, and that we are fully engaged with industry, Government and reviewers to improve and meet the expectations of a maturing sector.
As an organisation that exists to help farmers and growers measure, understand and reduce their carbon footprint, we always operate in the best interests of our users which includes ensuring our Calculator is as accurate as possible at all times. We are independent, providing a free carbon calculator for farmers and growers, and have a process of continual improvement in place. As a regular user of our Calculator, you can always compare current and past results using the most up-to-date Calculator, allowing you to track business progress to net zero.
You can find all you need to know about the Farm Carbon Calculator here. If you need more information please contact us at calculator@farmcarbontoolkit.org.uk or phone us on 07541 453413.
Announcing the launch of the 2024 Carbon Farmer of the Year Competition
February of this year sees the launch of the 2024 Farm Carbon Toolkit’s Carbon Farmer of the Year Competition. This competition champions UK farmers who are leading the way in adopting farming practices and developing new technologies which reduce farm emissions whilst optimising output, and adapting to climate change.
After the success of last year’s competition we are delighted to announce that the 2024 competition is now open for entries. Click here to learn more.
Lizzy Parker, our Carbon Calculator Manager, graduated her PhD from the University of Sheffield on Monday 8th January. Her thesis was on the role of the arbuscular mycorrhizal symbiosis in the physiological and metabolomic drought response of barley (how symbiotic root fungi can alter the barley plants’ chemistry and whether this helps them survive droughts – although she found that it didn’t help all that much actually).
Welcome to our January Farm Net Zero update, sharing news for our farmers, growers and the wider community this project supports.
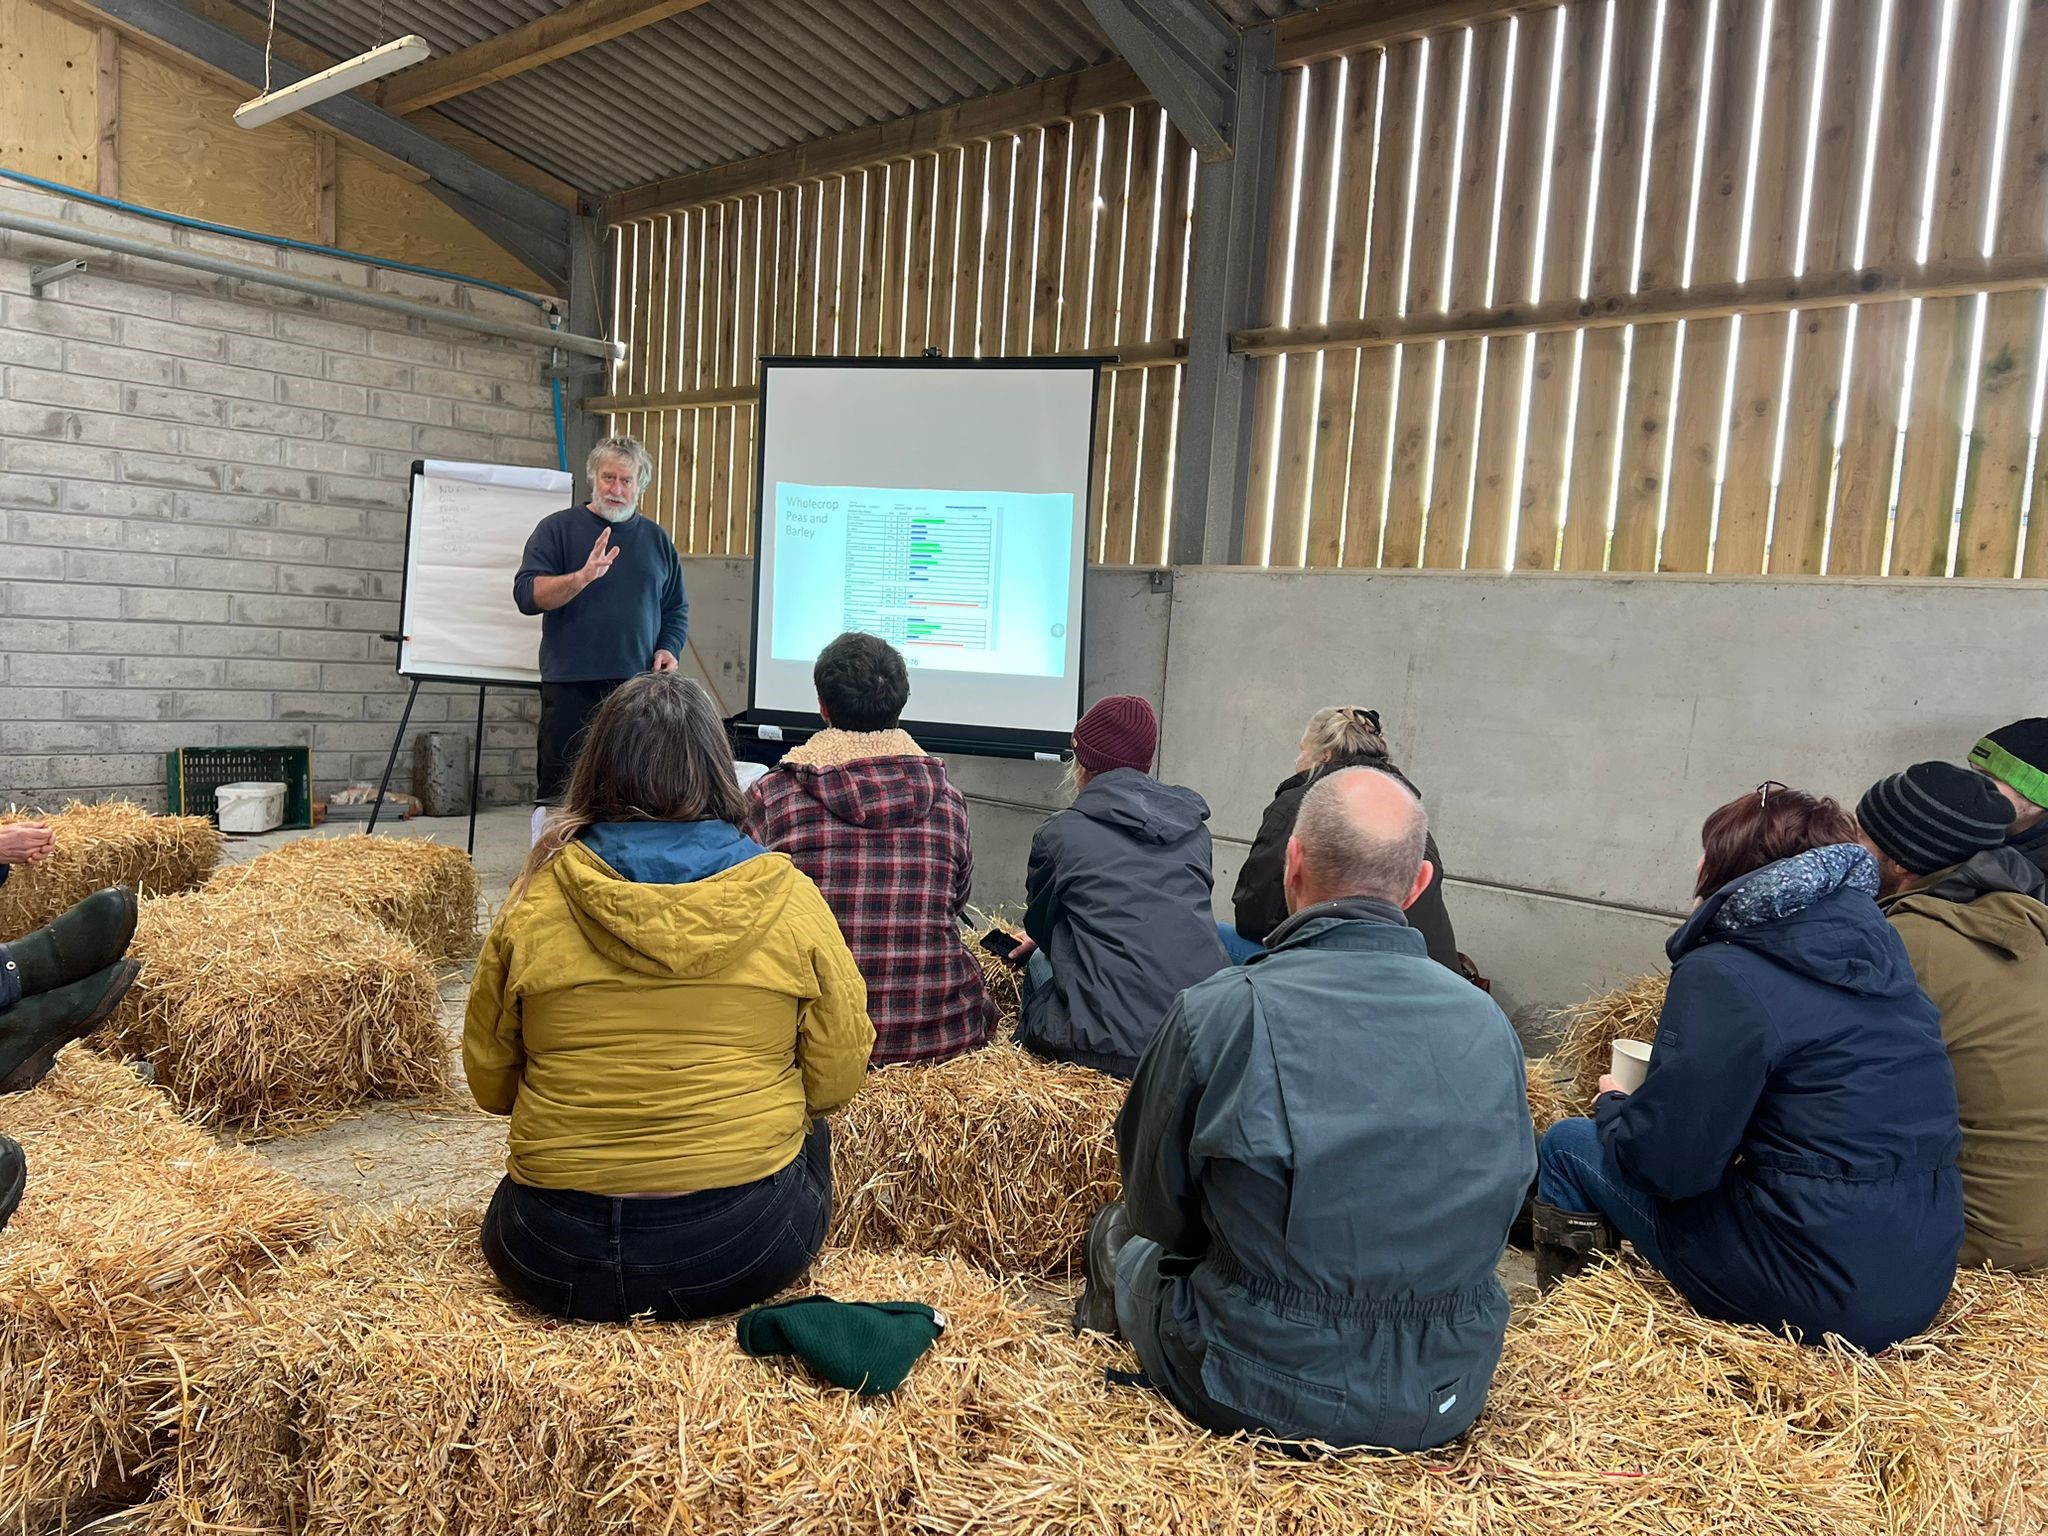
(Image above: Dr Dave Davies from Silage Solutions presenting to Farm Net Zeroat our silage event)
Recent news and events
Oxford Real Farming Conference: January 2024
On the 5th of January, Farm Net Zero will be presenting in a session entitled “It Takes a Farm Community to be Net Zero: A Case Study from Cornwall” at the Oxford Real Farming Conference. We are very much looking forward to showcasing the fantastic work our Demo and Monitor Farmers are doing and look forward to seeing some of you there. Hannah Jones will be introducing Farm Net Zero Demo Farmers Andrew Brewer, Mike Roberts and Anthony Ellis, who will be speaking about their experiences of reducing their farm carbon footprint. The session will also include a recent film of some of the Farm Net Zero farmers talking about the benefits of being part of a community. The film will be available on the Farm Net Zero webpage after the conference. Learn more here
Optimising Silage Production
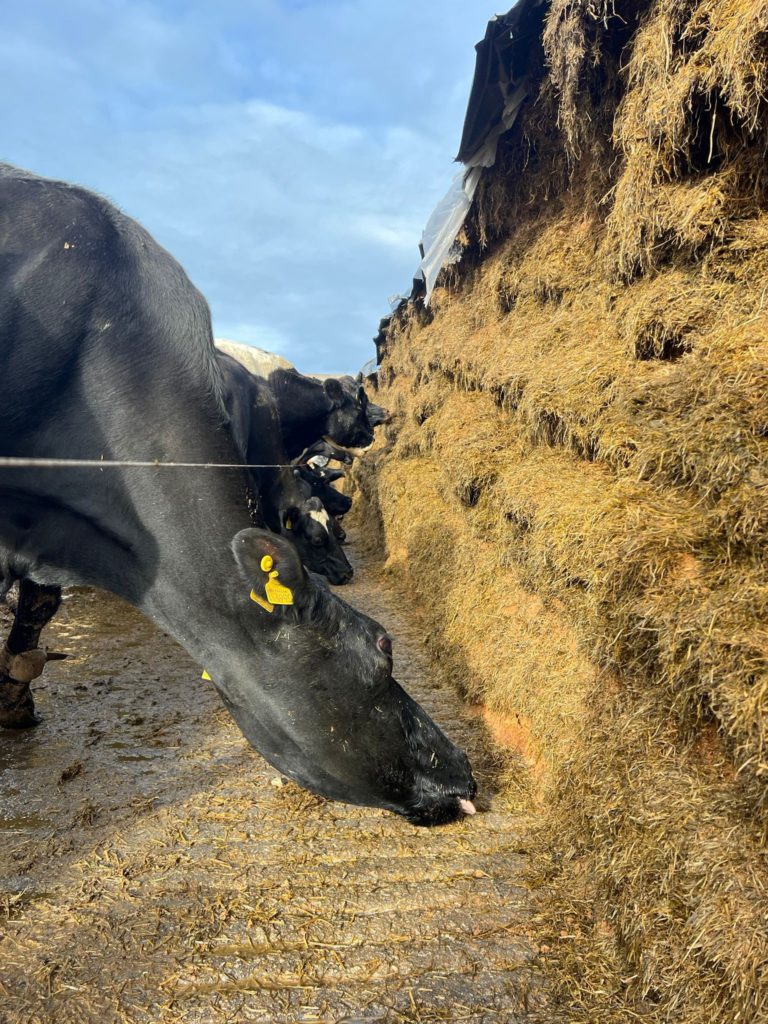
On the 16th November, Dr Dave Davies from Silage Solutions spoke at our silage event hosted by FNZ monitor farmer Phil Kent at Higher Carruan, St Minver. Dave took us through how to optimise silage production to reduce waste and maximise the quality and quantity of feed from the amount of fossil fuel used in silage production. We were also able to look at the Kent family’s self-feed silage clamp; and how this is saving costs and reducing emissions from machinery used for feeding cattle over winter. Learn more here
Self-feed silage in action
Integrating Livestock and Trees
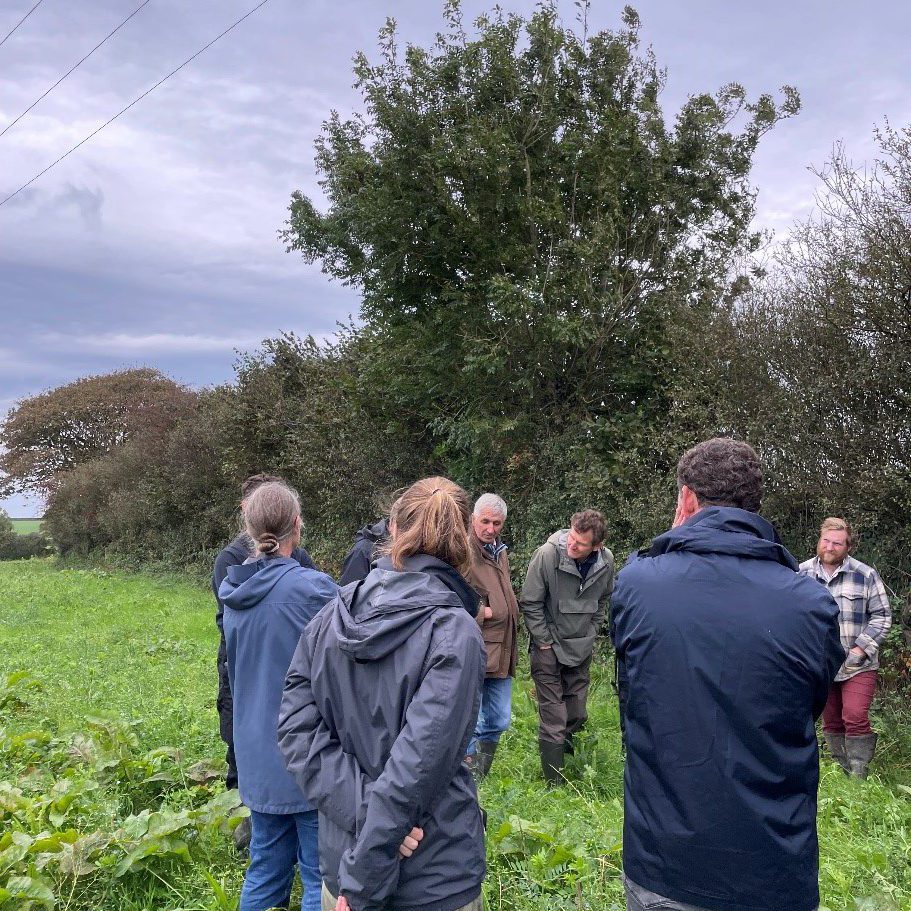
Dr Lindsay Whistance from the Organic Research Centre spoke at our event on integrating trees and livestock at FNZ Demo Farm, Blable near Wadebridge on the 27th September. Lindsay presented the results from a range of studies into animal behaviour in agroforestry systems and emphasised the importance of trees for optimal livestock performance through temperature regulation and feed value. Incorporating trees into the farm system benefits animal welfare and helps to reduce the farm’s carbon footprint. Learn more here
Attendees feeling the benefit of the hedgerow on a windy day
Lessons Learnt at Erth Barton
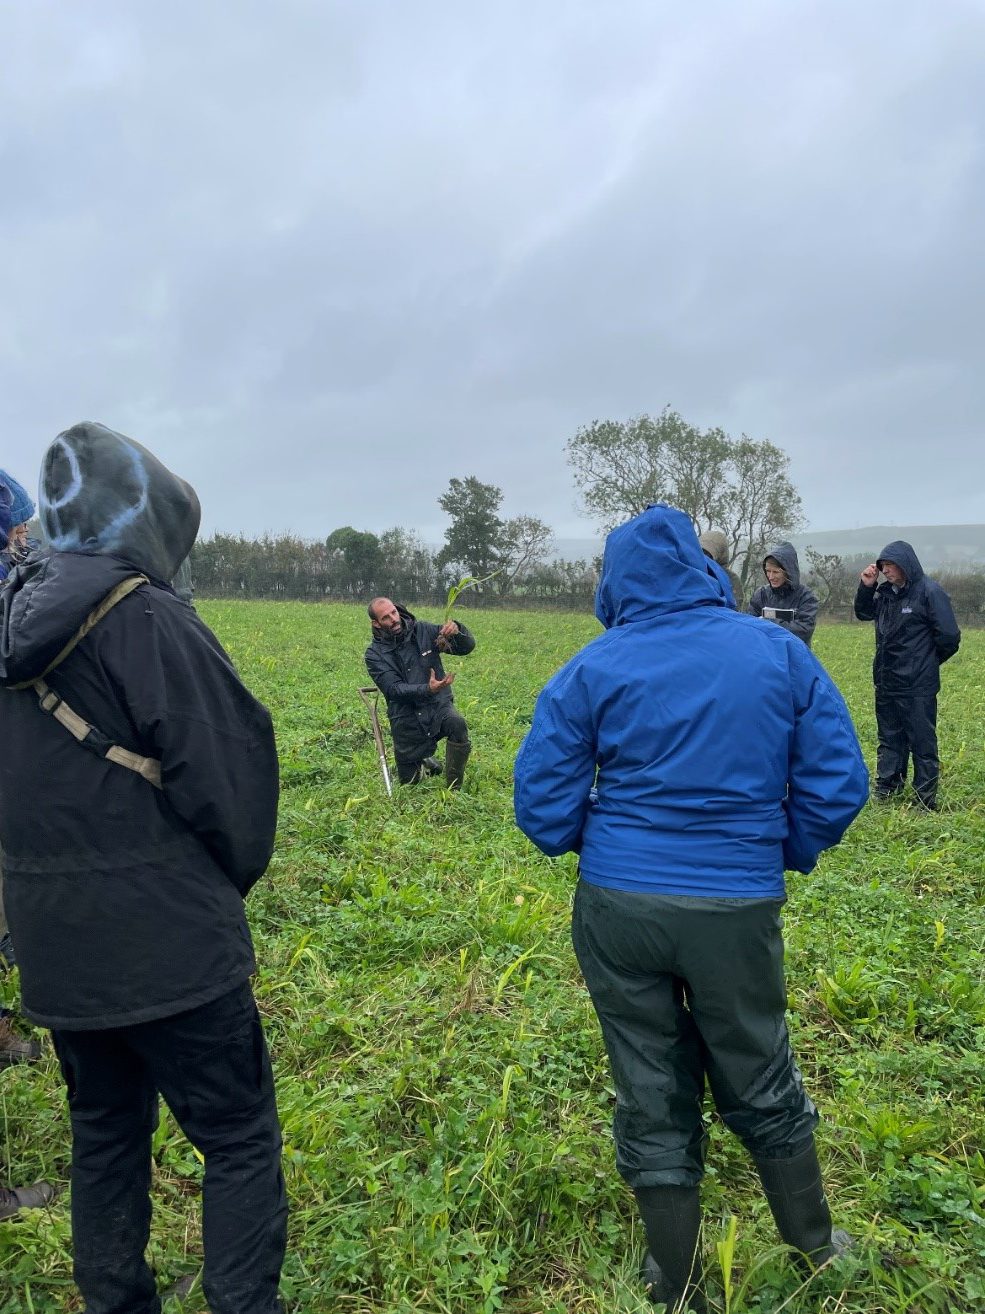
“Lessons Learnt at Erth Barton” on the 18th October summarised the work of Demo Farmer Tim Williams as he prepares to move on to new opportunities. Tim gave us a round-up of the successes and challenges he encountered during his time at Erth Barton, including introducing cattle rotational grazing of diverse herbal leys, pasture cropping and the use of compost as a soil health conditioner. We would like to thank Tim for his contribution to the Farm Net Zero project. Learn more here
Tim Williams and the power of plant roots
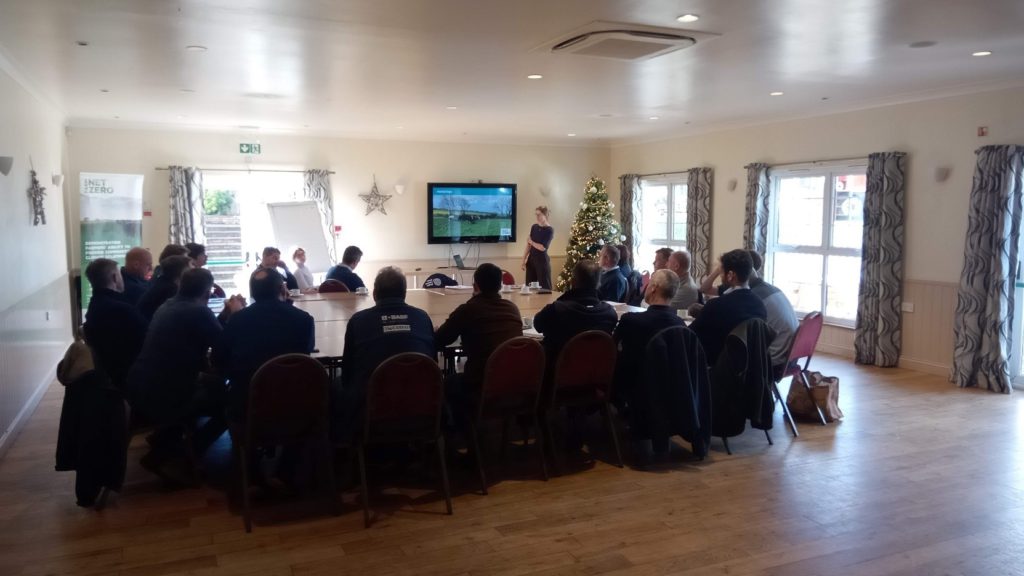
FNZ Agronomists’ Workshop
At the end of November, we organised a workshop for agronomists at Trethorne Leisure Farm where we were able to discuss some of the findings of the Farm Net Zero trials. This was a great chance to develop ideas and bring together the knowledge and experiences of agronomists and the Demo and Monitor Farmers. We had some excellent conversations on the results of the trials and the potential opportunities they present for farmers as the new Sustainable Farming Incentive comes into force. Learn more here
This year’s soil sampling is now complete and it has been exciting to see how the soil has changed since 2021. The soil carbon results are now being used to update carbon footprints, and it has been good to see some footprints reduced through soil carbon sequestration. We have a range of farm types on the project, to reflect the variety of farming found in East Cornwall. There are 4 market gardens, 10 dairy farms and 29 mixed livestock and arable producers (ranging from pasture-fed livestock to varying levels of cropping) on the project, and we hope to be able to pick out trends in carbon footprints based on farm type as we build the database year-on-year.
Community engagement
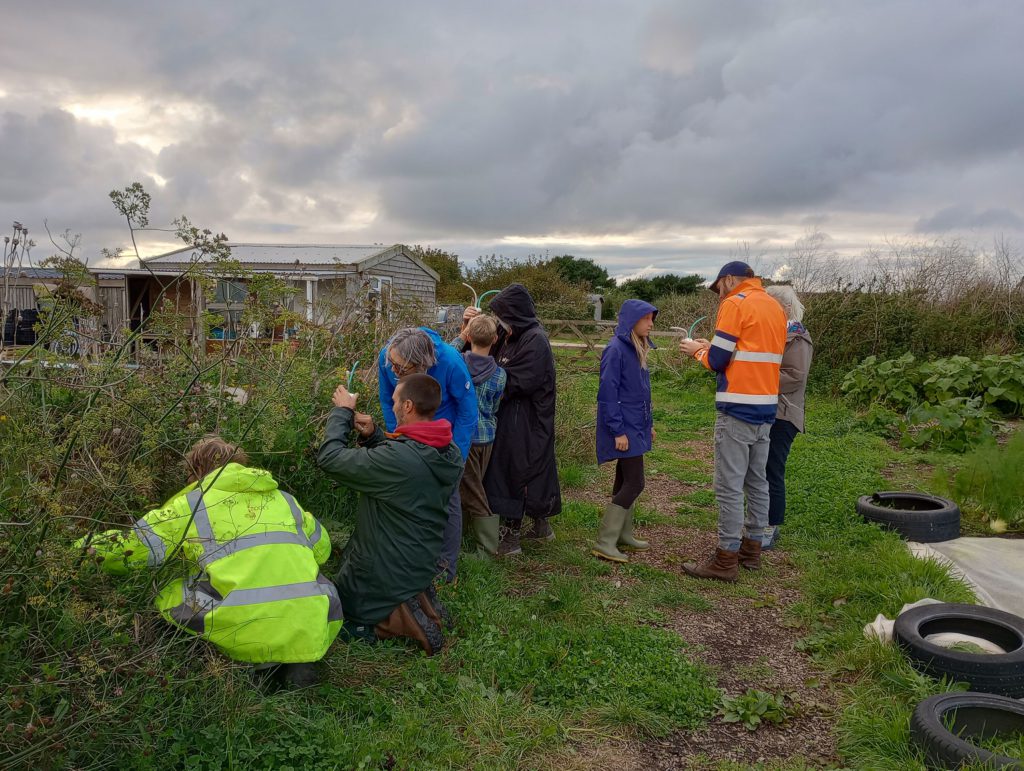
In September, Westcountry Rivers Trust held a Beneficial Bugs ID session at Community Roots market garden, near Porthtowan. On-site, there are many wild boundaries and herbaceous borders running across the beds to encourage pollination and provide year-round habitat for beneficial predators.
Westcountry Rivers Trust – Beneficial Bugs ID Session
Project officer Zoe Smith said: “Even this late in the year, we turned up plenty of interesting specimens from different areas of the garden with our pooters.
We also looked at some companion planting within the polytunnels and participants made a bee hotel log to take home to support bees in their own gardens.”
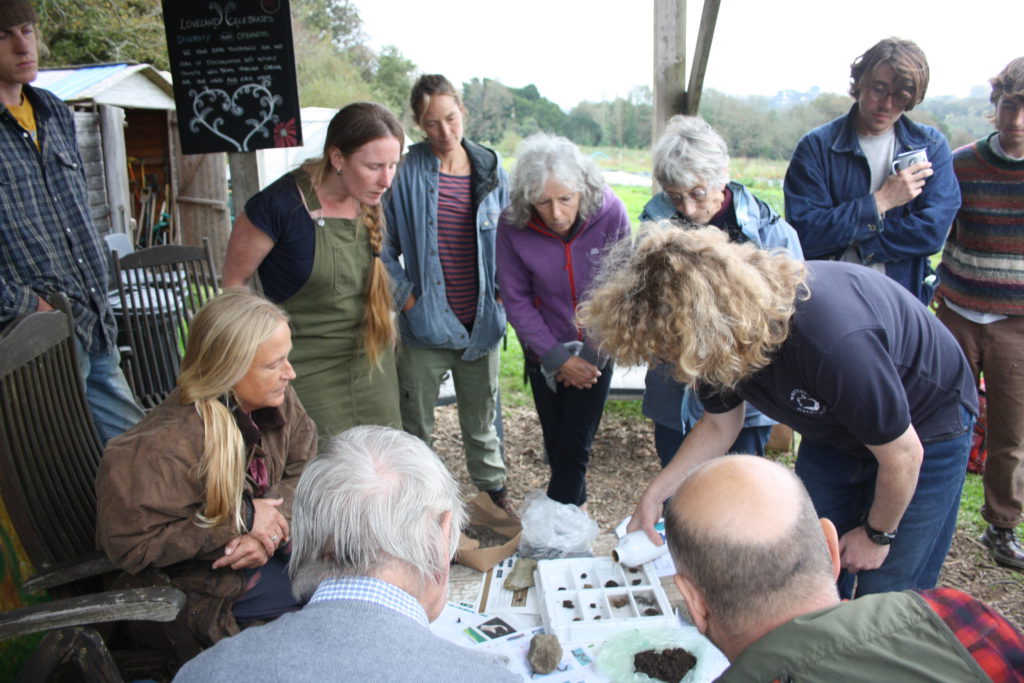
A Soil Health Indicators session at Loveland, Penryn, in October also took place. Several enthusiastic people brought soil samples from home to analyse, as well as digging soil pits in the garden itself and comparing compacted areas on the track with less intensively used grassland areas.
We’re still looking for new locations to run climate friendly gardening workshops.
If you have an allotment, community garden or smallholding within east or central Cornwall you are proud of, and are willing to share your story, please get in touch with Zoe via zoe@wrt.org.uk.
Current farm field trials
A little insight into some of the fab field trials currently underway as part of the FNZ project:
Targeting pathogens and weeds with compost managementThe first year of the compost field lab has produced some exciting results. Making compost on site can help growers capture carbon, retain nutrients, and reduce the dependence on bought-in fertiliser. But there is always a fear of spreading disease and weeds within the compost. To see if they could safely compost weed seeds and diseased material, one trialist tried burying them in the compost in bait bags. After 12 weeks they found that composting had killed the plant pathogen and turned weed propagules (bindweed and oxalis) to dust. For more information on how the trial was carried out, and other results, have a look at the Innovative Farmers website: Optimised compost management for productivity and soil health (innovativefarmers.org)
Update on Innovative Farmers field lab looking at reducing tillage in maize trialBy testing alternatives to ploughing, farmers are hoping to reduce the harmful impact of maize growing on soil structure, causing less erosion and runoff and reduce costs by using less fossil fuels. Results from the trial are still being processed but our initial thoughts are noted here. There are 3 fields with different systems:
The first set of results comparing strip till with ploughing showed that a strip till system didn’t result in visibly lower yields than a standard plough based system. When the weight of the yields were compared they showed that strip tilled plots had 5% less yield than ploughed strips, but with a significantly lower cost of production with less time and fuel use. There were more weeds present in the strip tilled area despite the same herbicide treatments on all plots. However, this was mainly grass weeds and biennial crops like thistles which were not effectively controlled by the pre drilling glyphosate.
In the second field the comparison was between a strip till, light cultivations and direct drilling. Drilling system and pre drill cultivation did have some effects, with the highest yield being a strip till plot followed by Min-till , and the lowest yield being direct drilled although differences were not large. There was again little to see from what the crop looked like to determine which was better without the weights.
The third set of results are still to be analysed.
Oxford Real Farming Conference, Oxford (various locations)4th-5th January 2024FCT is proud to be presenting at the famous Oxford Real Farming Conference next January. FCT’s Liz Bowles joins the panel for the ‘Capturing Carbon: Joining the Dots Between Policy and Practice’ session at 11am on Friday 5th January. At 2pm, FCT’s Hannah Jones chairs a panel session with farmers Mike Roberts, Andrew Brewer, and Anthony Ellis, asking ‘How can a farm reach net zero?’, along with a 20-minute video that features 5 farmers from the Farm Net Zero project FIND OUT MORE
Rootstock, Westpoint Exeter, Devon14th February 2024Organised by the Devon County Agricultural Association charity and hosted at its headquarters at Westpoint Exeter, Rootstock is a one-day, forward-looking conference for farmers in Southwest England. In its second year, this new conference brings farmers and researchers together to explore how farmers can build sustainable profitable businesses in tune with natural processes. Full details of the 2024 conference will be available shortly, including the topics for discussion and speaker announcements. FIND OUT MORE
You’ll find a full range of relevant events on our website.
We will be continuing to run a series of Farm Net Zero events in 2024, drawing on the needs and interests from the community of farmers. These will be advertised on our website and through this newsletter. If you have any suggestions for events we could run, please let us know.
Getting in touch
As ever, if you have any questions or ideas that would further support the community of farmers that we are working with, please get in touch with the project team (contact details below).
All information about the project including upcoming events and resources are available on the Farm Net Zero website. If there is anything you would like to see featured please let us know.
Written by Alex Bebbington, Project Officer, Rural Business School, Duchy College
This event was designed for agronomists to learn about the results of some of the Farm Net Zero (FNZ) trials. Dr. Hannah Jones of the Farm Carbon Toolkit was joined by the farmers who hosted and designed the trials to discuss the findings. This event was made possible with thanks to the National Lottery Community Fund who fund the Farm Net Zero project.
Throughout the discussions, the new Sustainable Farming Incentive (SFI) payments were referred to as a potential method of reducing the risk of adopting the practices trialled by the Farm Net Zero demo and monitor farms. This report will summarise the trials presented and the discussions that followed, including the views of the agronomists present at the workshop.
Outwintering on Cover Crops
Cover crops can be useful for protecting soil by reducing erosion and nutrient leaching and preserving soil carbon stocks. In Cornwall’s mixed farming systems, cover crops can provide an opportunity for outwintering livestock in a cost-effective manner. Therefore, it is pertinent to think about the plant species included in a cover crop mix and balance up their soil health benefits with the potential feed value.
A Farm Net Zero trial was set up in winter 2021-2022, where five cover crop mixes of varying complexity were grazed by beef youngstock. Full details of the trial can be found on the Farm Net Zero Project Resources page here. The most diverse mix had the biggest improvement in soil quality, reducing compaction and attracting the most earthworms. In terms of feed value, any mixes containing black oats were the most popular with the cattle and had high dry matter, crude protein and sugars.
It was suggested that the SFI SAM2 “Multi-species winter cover” payment of £129/hectare could be used to support this practice.
Maize Establishment
FNZ Monitor Farmers, Malcolm and Catherine Barrett, have trialled different methods of establishing maize crops. In spring 2022, two fields were taken and divided into thirds – one where maize was established conventionally (plough, power harrow, drill), one cultivated with a Sumo machine, and one direct drilled with a Mzuri drill. The direct drill had the lowest fuel requirement and therefore cost. Cob weight assessments found that cobs were smallest in the ploughed area and highest where the crop was established after the cultivator. Soil sampling showed that organic matter levels dropped following ploughing, with worm numbers also reduced.
One further area of interest developed when Malcolm and Catherine noticed that the sprayed-out clover regrew in the direct drilled area. This could potentially provide nitrogen for any following crops, and so a trial was designed for the barley drilled after maize harvest. In this trial, part of the field had no nitrogen applied in order to observe any influences of the clover. Quadrat yield assessments found no significant difference between the full nitrogen fertiliser regime and the no nitrogen area and further analysis of grain nitrogen found that both the full rate and zero nitrogen well exceeded the recommended level for feed barley. This prompted discussions on the opportunities for reducing nitrogen fertiliser (and therefore reducing carbon emissions), with most of the agronomists present agreeing that this is achievable, particularly on mixed farms where livestock contribute to healthy soil. One suggestion from the group was that where soil is in good condition, nitrogen could be applied as a foliar feed direct to the plant because the healthy soil is providing good support for the plant roots.
Soil Rejuvenation after Potatoes
On FNZ Demo Farm, Ennis Barton, some ground is let for vegetable production, when this comes back in hand Andrew Brewer wants to find the fastest method of restoring soil health and returning the fields to cattle grazing. In one of the potato fields, a variety of cover crops (eligible for SAM2) were undersown with ryegrass, clovers and plantain, these were then grazed over winter. Soil quality assessments found that mixes containing Westerwolds ryegrass had the most positive effect on soil aggregate stability. However, in the following summer the Westerwolds rapidly went to seed, which made managing grazing quality a challenge. Therefore, the next best cover mix was forage rape or rye and vetch. This is another example of considering the trade-offs of mixed farming when designing systems that optimise soil quality.
Inter-Crops for Cabbages
Some of the ground rented out at Ennis Barton is used for Savoy cabbages. Following a Farm Net Zero meeting looking at managing these “risky crops”, Andrew and the cabbage growers were keen to develop methods of reducing soil erosion between the cabbage rows. A trial was designed where a mix of low-growing, deep-rooted species (chicory, plantain, white clover and buckwheat) were intersown between the cabbage rows at the beginning of October after all cabbage hoeing was completed. This trial is still being monitored, but there are hopes that intercropping will protect soil from erosion, provide feed for livestock and also reduce the amount of disease/damage to the cabbage leaf from “soil bounce” after rain. Again, this could be eligible for the SAM2 SFI payment.
Grazing Winter Cereals
Grazing winter cereals was a common practice to manage plant disease, growth rates, fertility and livestock wintering. FNZ Monitor Farmer, Anthony Ellis, tried a return to this practice on his family arable and sheep farm during winter 2022-2023. Part of a field of winter wheat was grazed with ewe lambs, with the wheat grazed right into the ground. This allowed Anthony to reduce growth regulators and fungicide and slightly reduce the nitrogen applications compared to the ungrazed remainder of the field. Septoria was reduced early in the season, but there was less difference closer to harvest as the grazed wheat caught up with the ungrazed. Some discussion followed concerning how although this is an old practice, it is now possible to put some firmer figures on the carbon savings of reduced inputs from grazing cereals.
Conclusion
Overall, this workshop for agronomists provided an excellent opportunity to share some of the project’s results so far, and to learn from agronomists who work across the project region and further afield. The ability to work collaboratively with the wider agricultural community is very valuable and helps to ensure the Farm Net Zero project reflects as many farming systems as possible.


Recent Comments